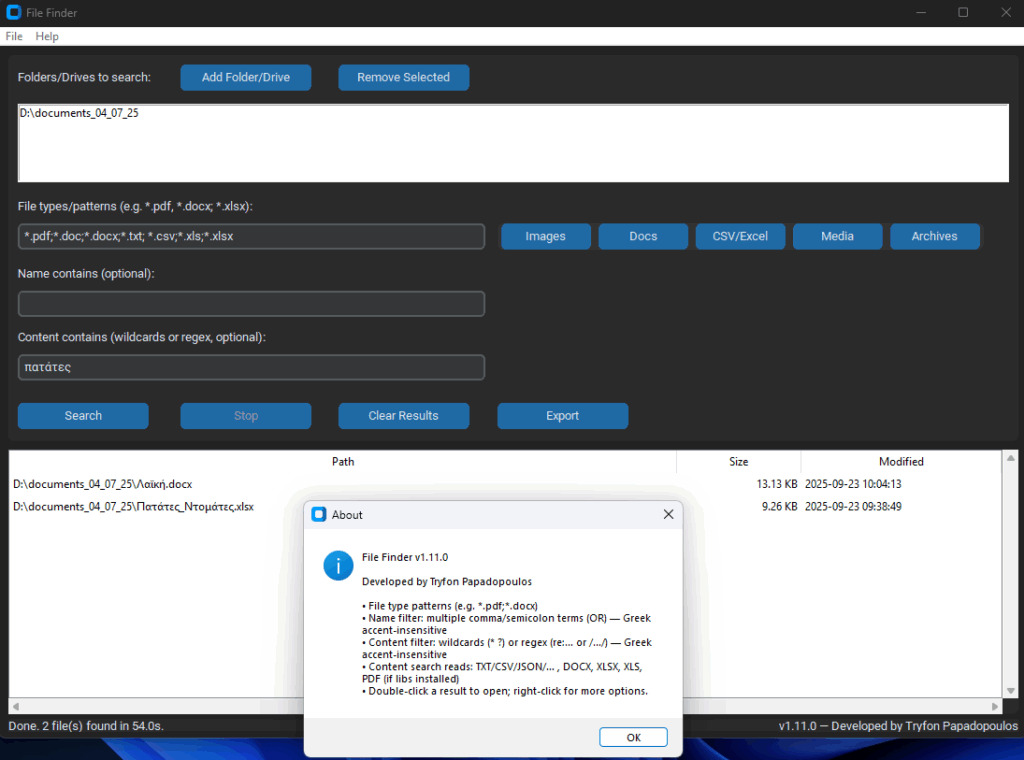
File Finder – Εύκολη και έξυπνη αναζήτηση αρχείων GR – Αυτή η εφαρμογή σε βοηθά να βρίσκεις γρήγορα αρχεία στον υπολογιστή σου. =>Διαλέγεις έναν ή περισσότερους φακέλους ή δίσκους για αναζήτηση. =>Λες τι τύπους αρχείων θέλεις (π.χ. PDF, Word, Excel, εικόνες). =>Μπορείς να γράψεις μέρος του ονόματος του/των αρχείου/ων που ψάχνεις. =>Μπορείς και να ψάξεις μέσα στα αρχεία για λέξεις ή φράσεις. =>Διαβάζει μέσα σε Word, PDF, Excel (όλα τα φύλλα), CSV και απλά κείμενα. =>Καταλαβαίνει ελληνικά και χωρίς τόνους (π.χ. “παρουσιαση” βρίσκει “παρουσίαση”). =>Τα αποτελέσματα δείχνουν πλήρη διαδρομή, μέγεθος και ημερομηνία αλλαγής. =>Με διπλό κλικ ανοίγεις το αρχείο. =>Μπορείς να αποθηκεύσεις τη λίστα σε CSV ή Excel. EN – This app helps you quickly find files on your computer. =>You choose one or more folders or drives to search. =>You tell it what kinds of files you want (like PDF, Word, Excel, images). =>You can type part of a…
Πρόβλημα «Έχεις γεμίσει τον υπολογιστή με εικόνες και δεν βρίσκεις άκρη; Με αυτή την εφαρμογή βρίσκεις τις διπλότυπες και παρόμοιες εικόνες σε λίγα δευτερόλεπτα — και κερδίζεις χώρο με ένα κλικ.» Λύση «Διαλέγεις φάκελο ή δίσκο και πατάς “Scan for duplicates”. Η εφαρμογή ομαδοποιεί τα ίδια αρχεία και σου δείχνει μικρογραφίες, πλήρη διαδρομή και ημερομηνία τροποποίησης.» «Οι επιλογές συγχρονίζονται αριστερά και δεξιά, ώστε να βλέπεις ακριβώς ποια αρχεία είναι διπλά. Με Delete τα στέλνεις στον Κάδο Ανακύκλωσης με ασφάλεια.» «Και τώρα το αγαπημένο μου: Find similar. Διαλέγω μια εικόνα–πρότυπο και φάκελο αναζήτησης. – Στον κλασικό τρόπο, η εφαρμογή συνδυάζει dHash, aHash και χρώματα. – Στον σημασιολογικό τρόπο, χρησιμοποιεί AI (CLIP) και FAISS. Βλέπεις την μπάρα προόδου στο πρώτο χτίσιμο, ενώ τα αποτελέσματα αποθηκεύονται σε cache για να τρέχει πιο γρήγορα την επόμενη φορά που θα χρησιμοποιήσεις την εφαρμογή.» «Παίρνεις τα Top-5 πιο κοντινά αποτελέσματα, με ποσοστό ομοιότητας, μέγεθος και ημερομηνία.…
Marketing has changed forever. With the use of AI, things get easier and most of the cases nicer. You can change countries. You can change locations. You can change logos. You can change everything. If you’d like to see how Custom CLI Chatbot v16 with Image Mixer can support your work, contact me. *This is only for demonstration purposes. www.mindstorm.gr
A lightweight Python command-line tool that guides you step-by-step to remix images with Google’s Gemini. It asks to choose the images and output folders, select 1–5 images, and then either pick a ready-made prompt or type your own. It streams results from the model, saves the generated images to your chosen output directory (while skipping any output folders when listing images), supports flags/env overrides, and finishes with a friendly “Hit Enter to close the window…” prompt. Ένα ελαφρύ εργαλείο γραμμής εντολών σε Python που σε καθοδηγεί βήμα-βήμα για να κάνεις remix εικόνων με το Gemini της Google. Σου ζητά να διαλέξεις τους φακέλους images και output, να επιλέξεις 1–5 εικόνες και έπειτα είτε να διαλέξεις ένα έτοιμο prompt είτε να γράψεις το δικό σου. Κάνει streaming των αποτελεσμάτων από το μοντέλο, αποθηκεύει τις παραγόμενες εικόνες στον φάκελο εξόδου που επέλεξες (παραλείποντας τυχόν φακέλους output όταν κάνει λίστα τις εικόνες), υποστηρίζει…
A lightweight Python command-line tool that guides you step-by-step to remix images with Google’s Gemini. It asks to choose the images and output folders, select 1–5 images, and then either pick a ready-made prompt or type your own. It streams results from the model, saves the generated images to your chosen output directory (while skipping any output folders when listing images), supports flags/env overrides, and finishes with a friendly “Hit Enter to close the window…” prompt. Ένα ελαφρύ εργαλείο γραμμής εντολών σε Python που σε καθοδηγεί βήμα-βήμα για να κάνεις remix εικόνων με το Gemini της Google. Σου ζητά να διαλέξεις τους φακέλους images και output, να επιλέξεις 1–5 εικόνες και έπειτα είτε να διαλέξεις ένα έτοιμο prompt είτε να γράψεις το δικό σου. Κάνει streaming των αποτελεσμάτων από το μοντέλο, αποθηκεύει τις παραγόμενες εικόνες στον φάκελο εξόδου που επέλεξες (παραλείποντας τυχόν φακέλους output όταν κάνει λίστα τις εικόνες), υποστηρίζει…
Αν έχετε βαρεθεί να ψάχνετε τις απαντήσεις που θέλετε μέσα σε αρχεία pdf, τότε μπορούμε να σας βοηθήσουμε. Δείτε τις στοχευμένες απαντήσεις που δίνει το Custom Chatbot που έχουμε φτιάξει με τη βοήθεια της τεχνητής νοημοσύνης. Μπορείτε να προσθέσετε οποιαδήποτε αδόμητη και άσχετη πληροφορία στο αρχείο pdf με οποιαδήποτε σειρά, και το chatbot θα βρει την απάντηση που ανταποκρίνεται στο ερώτημά σας, εφόσον υπάρχει. www.mindstorm.gr Δείτε ένα τμήμα του περιεχομένου (screeshot) του αρχείου PDF στο οποίο έγιναν οι ερωτήσεις και από το οποίο αντλήθηκαν οι απαντήσεις.
CRUD Chatbot που «μαθαίνει» από τον χρήστη (έκδοση 10) – Απλή εξήγηση & γρήγορη χρήση Python script και επιμέλεια άρθρου: Tryfon Papadopoulos Ο παρακάτω κώδικας φτιάχνει έναν απλό chatbot κονσόλας που: απαντά σε ερωτήσεις από μια βάση γνώσης (JSON), μαθαίνει νέες απαντήσεις όταν δεν ξέρει, επιτρέπει Αναζήτηση/Προβολή/Επεξεργασία/Διαγραφή (CRUD) ερωτήσεων, κάνει ασαφή αντιστοίχιση (fuzzy match) με υποστήριξη ελληνικών (χωρίς τόνους, αδιαφορεί για πεζά/κεφαλαία, «ς/σ»), μπορεί να στείλει email με έτοιμο θέμα/κείμενο, και να εξάγει το ιστορικό συνομιλίας σε αρχείο. Τι χρειάζομαι; Python 3 Ένα αρχείο γνώσεων (JSON) στη θέση που ορίζει ο κώδικας: KB_PATH = r”c:\PythonPrograms\build_chatbot\knowledge_base.json” Αν δεν υπάρχει, δημιουργήστε το με περιεχόμενο: { “questions”: [] } Σε macOS/Linux αλλάξτε το KB_PATH σε μια δική σας διαδρομή, π.χ. /Users/…/knowledge_base.json.) (Προαιρετικό) Για αποστολή email μέσω Outlook: εγκατεστημένο Outlook και το πακέτο pywin32. Χωρίς αυτά, γίνεται fallback σε mailto: του προεπιλεγμένου email client (πιθανό όριο μεγέθους σώματος). Δείτε το σχετικό βίντεο… Πώς το…
Sentiment analysis is a type of natural language processing (NLP) technique that aims to determine the emotional tone or attitude conveyed by a piece of text, such as a review, comment, or social media post. It’s used to analyze the sentiment behind text data and provide insights on how people feel about a particular topic, product, service, or idea. Sentiment analysis involves analyzing the linguistic features of a piece of text, including: Words: Emotionally charged words like “good”, “bad”, “great”, “terrible”, etc. Phrases: Sentences or phrases that convey strong emotions Tone: The overall emotional tone of the text The goal of sentiment analysis is to assign a score or label to indicate whether the sentiment is positive, negative, or neutral. This can be done using various machine learning models, such as: Supervised learning: Train algorithms on labeled datasets to learn patterns in language and predict sentiment. Unsupervised learning: Use unsupervised…
Common Marketing Problems in the Food Industry Customer Awareness and Brand Recognition: Many food brands struggle with building customer awareness and brand recognition, especially in highly competitive markets. Challenge: How to differentiate the brand and make it stand out among competitors. Possible Scenario: Low customer engagement, low social media interaction, and low brand recall. Pricing Strategy: Determining the right pricing strategy can be tricky, especially with the fluctuating costs of ingredients and the pressure from competitors. Challenge: Balancing between competitive pricing and maintaining profit margins. Possible Scenario: Competitor price drops, increases in production costs, or demand sensitivity to pricing. Product Distribution and Reach: Ensuring that products reach the target market efficiently is crucial, and many companies face issues with distribution logistics. Challenge: Expanding distribution channels while managing logistics costs and maintaining product quality. Possible Scenario: Limited shelf space, issues with supply chain efficiency, or new market entry. Changing Consumer Preferences:…
Use ‘Sheet1’ (data) in excel file: sales_jan_feb_mar_2021_d.xlsx and do the following: 1) Read all columns of the excel file: sales_jan_feb_mar_2021_d.xlsx – 9 columns 2) Read specific columns of the excel file (Month, Actual_Sales, Customer, Salesperson): sales_jan_feb_mar_2021_d.xlsx – 4 columns 3) Create new excel file: Actual_Sales Mean by Salesperson.xlsx 4) Create new excel file: Actual_Sales Mean by Customer.xlsx 5) Create new excel file: Actual_Sales Mean by Month.xlsx 6) Create new tab: ActSalesMean by Salesperson in existing excel file: sales_jan_feb_mar_2021_d.xlsx and find actual sales mean by salesperson 7) Create new tab: ActSalesMean by Customer in existing excel file: sales_jan_feb_mar_2021_d.xlsx and find actual sales mean by customer 8) Create new tab: ActSalesMean by Month in existing excel file: sales_jan_feb_mar_2021_d.xlsx and find actual sales mean by month 9) Plot Actual_Sales Mean for 3, 4 and 5 10) Change styling of columns (font, alignment) for tabs: ‘ActSalesMean by Salesperson’, ‘ActSalesMean by Customer’, ‘ActSalesMean by Month’…
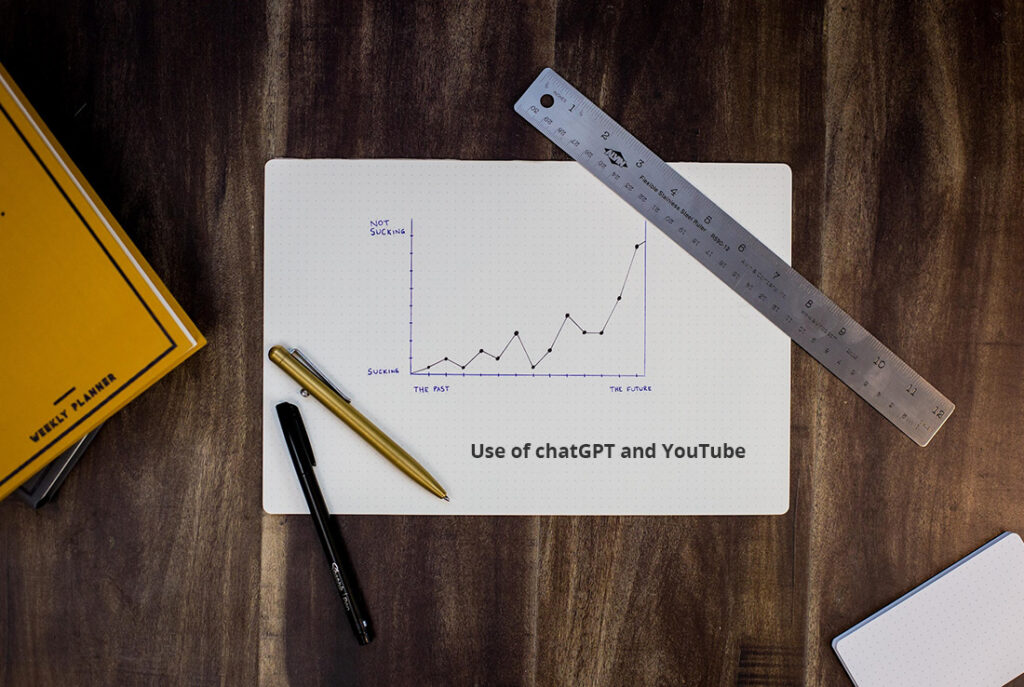
Use of chatGPT and YouTube to become a Data Analyst – Χρήση του chatGPT και του YouTube για να κάνει κάποιος ανάλυση δεδομένων Code file: app.py Folder: C:\PythonPrograms\data_analysis_with_chatGPT 1) Merge multiple excel files – Συγχώνευση πολλών αρχείων excel data1.xlsx data2.xlsx data3.xlsx data4.xlsx 2) Clean data – Καθαρισμός δεδομένων 3) Create two excel reports (Total Revenue, Expenses and Profit by Category) and (Total Revenue, Expenses and Profit by Country) – Δημιουργία δύο αρχείων excel (category_report.xlsx and country_report.xlsx) 4) Add a chart to category_report.xlsx – Προσθήκη γραφήματος στο αρχείο excel category_report.xlsx 5) Add a chart to country_report.xlsx – Προσθήκη γραφήματος στο αρχείο excel country_report.xlsx 6) Build two interactive plots (category_chart.html and country_chart.html) 7) Create a streamlit dashboard with 2 graphs – Δημιουργία ενός πίνακα προβολής και διαχείρισης streamlit με 2 γραφήματα με τη βοήθεια της γλώσσας Python – with Python. Changed code by Trifonas Papadopoulos: #Code starts…
Scenario for using Python and Excel Request 1 Take the following 3 excel files: sales_jan_2022.xlsx sales_feb_2022.xlsx sales_mar_2022.xlsx and create a new excel: sales.xlsx and a new csv file: sales.csv with all the records from these 3 excel files. Request 2 Take the following 3 excel files: sales_jan_2022.xlsx sales_feb_2022.xlsx sales_mar_2022.xlsx and create a new excel: total_sales.xlsx and a new csv file: total_sales.csv with total of Actual_Quantity for each month. Request 3 Take the following 3 excel files: sales_jan_2022.xlsx sales_feb_2022.xlsx sales_mar_2022.xlsx and create a new excel: total_sales_by_salesperson.xlsx and a new csv file: total_sales_by_salesperson.csv with total of Actual_Sales per month for each salesperson. Request 1, 2 and 3 are completed with python script: main.py. See it in action . . . (watch the video below) Request 4 Take the following excel files: sales.xlsx total_sales_by_salesperson.xlsx and change the styling so it is easier to read them. Request 4 is…
Did you know you can use Python code to create an Excel Data Entry Form and avoid duplicate records? Πώς να δημιουργήσετε μια φόρμα εισαγωγής δεδομένων σε 10 λεπτά με τη γλώσσα προγραμματισμού PYTHON (No VBA) Πώς να διασφαλίσετε ότι δεν θα κάνετε διπλοεγγραφές Excel fields : Name, City, Favorite Color, German, Spanish, English, Children Excel before data entry Data entry form Excel after data entry ‘Python code starts here. import PySimpleGUI as sg import pandas as pd # Add some color to the window sg.theme(‘DarkTeal9’) EXCEL_FILE = ‘data_entry.xlsx’ df = pd.read_excel(EXCEL_FILE) layout = [ [sg.Text(‘Please fill out the following fields:’)], [sg.Text(‘Name’, size=(15,1)), sg.InputText(key=’Name’)], [sg.Text(‘City’, size=(15,1)), sg.InputText(key=’City’)], [sg.Text(‘Favorite Color’, size=(15,1)), sg.Combo([‘Green’, ‘Blue’, ‘Red’], key=’Favorite Color’)], [sg.Text(‘I speak’, size=(15,1)), sg.Checkbox(‘German’, key=’German’), sg.Checkbox(‘Spanish’, key=’Spanish’), sg.Checkbox(‘English’, key=’English’)], [sg.Text(‘No. of Children’, size=(15,1)), sg.Spin([i for i in range(0,16)], initial_value=0, key=’Children’)], [sg.Submit(), sg.Button(‘Clear’), sg.Exit()] ] window = sg.Window(‘Simple data entry form’, layout) def clear_input(): for key…
Πως να επιλέγετε γραμμές και στήλες με τη βιβλιοθήκη pandas της γλώσσας προγραμματισμού Python See below the data and the code for the result shown on image . . . How to select rows and columns in pandas # Credit : Trifonas Papadopoulos, Oct 4th, 2022, Version 2.0 # start of code —————————————————————————————– import pandas as pd import numpy as np # data data = [[‘A0001′,”,”,”,0,’variable’,0,0], [‘A0001′,’WHITE’,’S’,’Small’,1,’variation’,0,0], [‘A0001′,’WHITE’,’M’,’Medium’,2,’variation’,0,0], [‘A0001′,’WHITE’,’L’,’Large’,3,’variation’,0,0], [‘A0001′,’WHITE’,’XL’,’Extra Large’,4,’variation’,0,0], [‘A0001′,’BLACK’,’L’,’Large’,5,’variation’,0,0], [‘A0003′,”,”,”,6,’variable’,0,0], [‘A0003′,’BLACK’,’XL’,’Extra Large’,7,’variation’,0,0], [‘A0002′,”,”,”,8,’variable’,0,0], [‘A0002′,’BLACK’,’L’,’Large’,9,’variation’,0,0], [‘A0002′,’BLACK’,’XL’,’Extra Large’,10,’variation’,0,0], [‘A0004′,”,”,”,12,’variable’,0,0], [‘A0004′,’WHITE’,’S’,’Small’,12,’variation’,0,0], [‘A0004′,’RED’,’S’,’Small’,13,’variation’,0,0], [‘A0004′,’RED’,’M’,’Medium’,14,’variation’,0,0], [‘A0001′,’WHITE’,’XXL’,’2 Extra Large’,15,’variation’,0,0], ] # print list of columns print(‘–list of columns———————————————————–‘) cols = list(df.columns.values) print(cols) # dataframe with defined column names df = pd.DataFrame(data, columns=[‘parent’, ‘color’, ‘size’, ‘size_desc’, ‘order’, ‘type’, ‘quantity’,’price’]) print(”) print(‘–dataframe with defined column names—————————————‘) print(df) # end of code —————————————————————————————– If you want to see more ways to select rows and columns in pandas (Python), read my code (Version…
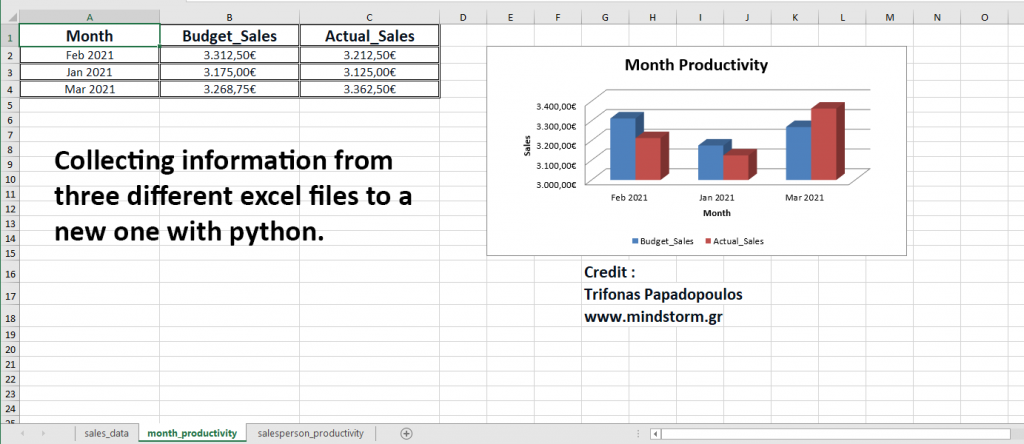
Excel file 1 : sales_january_2021_d.xlsx – Download : https://lnkd.in/dyT6zrCX Excel file 2 : sales_feb_2021_d.xlsx – Download : https://lnkd.in/d5aaNWiq Excel file 3 : sales_march_2021_d.xlsx – Download : https://lnkd.in/d-G2hNiM Task Collection of data from the above mentioned three different excel files and creation of a new one : sales_jan_feb_mar_2021_d.xlsx – Download : https://lnkd.in/d-PTEPtv with three different sheets : sales_data month_productivity salesperson_productivity We did a comparison between Budget and Actual Sales. The reason we did this is to know the month productivity and the salesperson productivity for months Jan, Feb and Mar 2021. All sheets, data, graphs and styling in file : sales_jan_feb_mar_2021_d.xlsx have been created automatically with python coding. Tools used : Excel, Python #programming #coding #python #productivity #data_analysis #mindstormGR / www.mindstorm.gr Code for this project from ctypes.wintypes import WORD import pandas as pd import numpy as np import matplotlib.pyplot as plt importopenpyxl from openpyxl.styles import PatternFill, Border, Side, colors, Alignment, Protection,…


