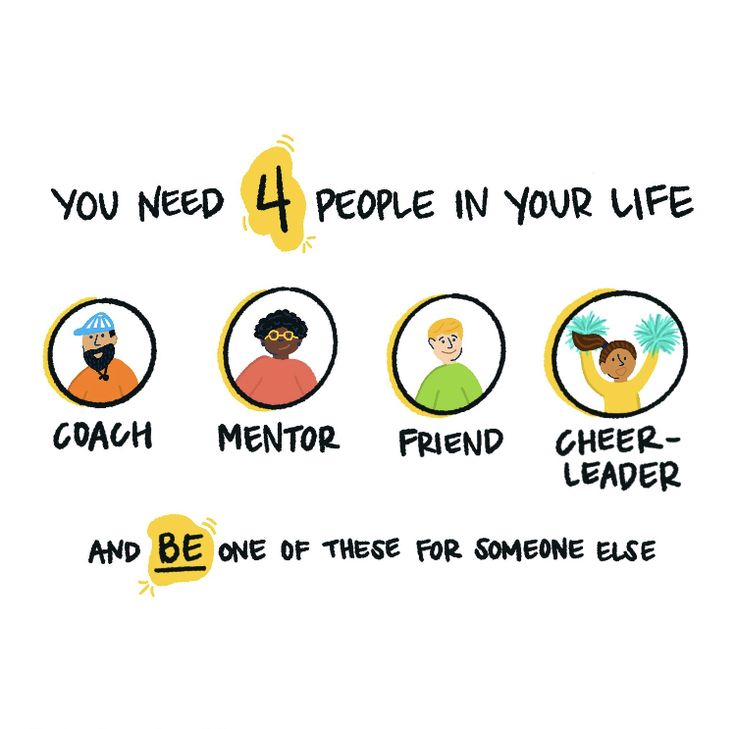
You need 4 people in your life. – Coach – Mentor – Friend – Cheerleader and be one of these for someone else.


EN – 18 Quiet Habits of Top Salespeople They close deals without making noise. They let the client talk first and last. They sell the outcome, not the product. They stay in the room when others walk away. They control emotions – no highs, no lows. They let silence do the heavy lifting. They never beg for the deal. They earn respect, not attention. They keep their poker face, no matter what’s said. They handle objections before they’re spoken. They kill jargon and speak human. They don’t just follow up – they stay top of mind. They never overpromise. They work the deal, not the room. They show up ready, not hopeful. They make clients feel they discovered the solution. They know when to put their ego aside. They focus on the client, not their own agenda. — GR – 18 Συνήθειες των Κορυφαίων Πωλητών Κλείνουν συμφωνίες χωρίς να κάνουν θόρυβο.…


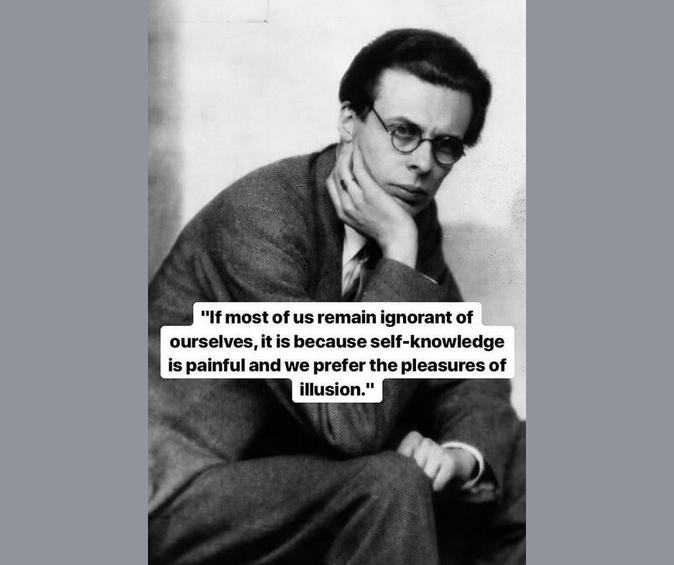
If most of us remain ignorant of ourselves, it is because self-knowledge is painful and we prefer the pleasures of illusion. Οι περισσότεροι από εμάς παραμένουμε στο ίδιο σημείο. Στην άγνοιά μας. Στην καθημερινότητά μας. Η αυτογνωσία είναι επίπονη. Βολευόμαστε με το να απολαμβάνουμε τον επιφανειακό μικρόκοσμό μας. #knowledge #illusion #ignorance #mindstormGR
GR – To SCAMPER είναι ένα ακρωνύμιο που αναπαριστά διαφορετικές προσεγγίσεις για τη δημιουργία νέων ιδεών: S (Substitute): Αντικατάσταση – Τι μπορούμε να αντικαταστήσουμε; Ποια μέρη, υλικά ή διαδικασίες μπορούμε να αλλάξουμε; C (Combine): Συνδυασμός – Τι μπορούμε να συνδυάσουμε; Ποιες ιδέες, λειτουργίες ή στοιχεία μπορούμε να συνδυάσουμε; A (Adapt): Προσαρμογή – Τι μπορούμε να προσαρμόσουμε; Πώς μπορούμε να αλλάξουμε ή να τροποποιήσουμε κάτι για να το κάνουμε πιο χρήσιμο; M (Modify): Τροποποίηση – Τι μπορούμε να τροποποιήσουμε; Πώς μπορούμε να αλλάξουμε το μέγεθος, το σχήμα, το χρώμα, ή άλλες ιδιότητες; P (Put to another use): Άλλη χρήση – Πώς μπορούμε να χρησιμοποιήσουμε κάτι με διαφορετικό τρόπο; Ποιες άλλες εφαρμογές μπορεί να έχει; E (Eliminate): Αφαίρεση – Τι μπορούμε να αφαιρέσουμε; Ποια μέρη, στοιχεία ή λειτουργίες μπορούμε να αφαιρέσουμε; R (Reverse): Αντιστροφή – Πώς μπορούμε να αντιστρέψουμε κάτι; Τι θα συμβεί αν αντιστρέψουμε τη διαδικασία ή τα στοιχεία; EN – SCAMPER…
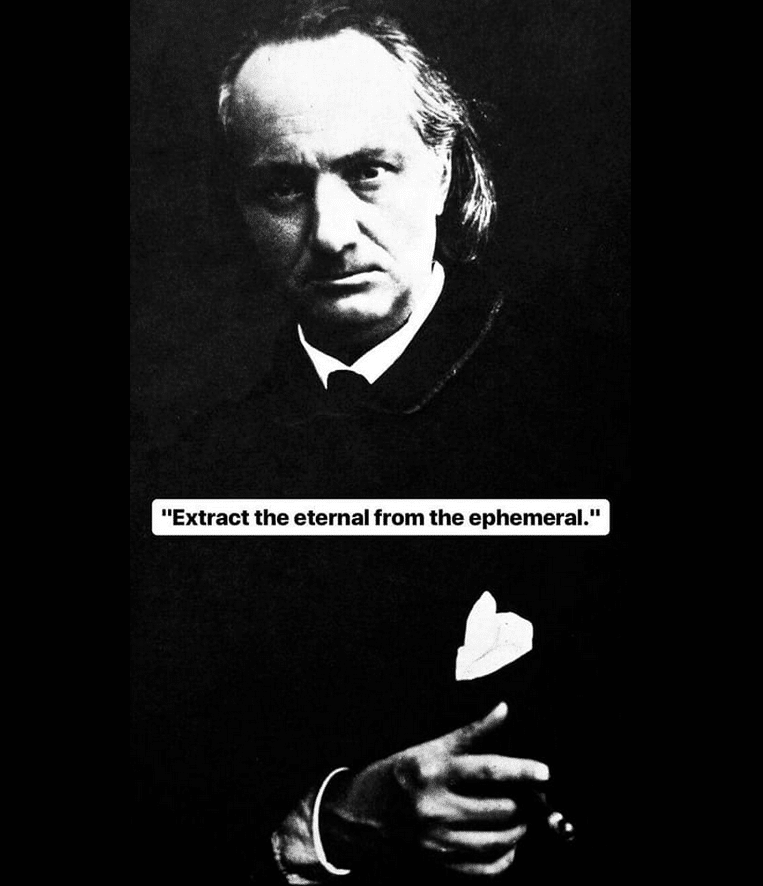
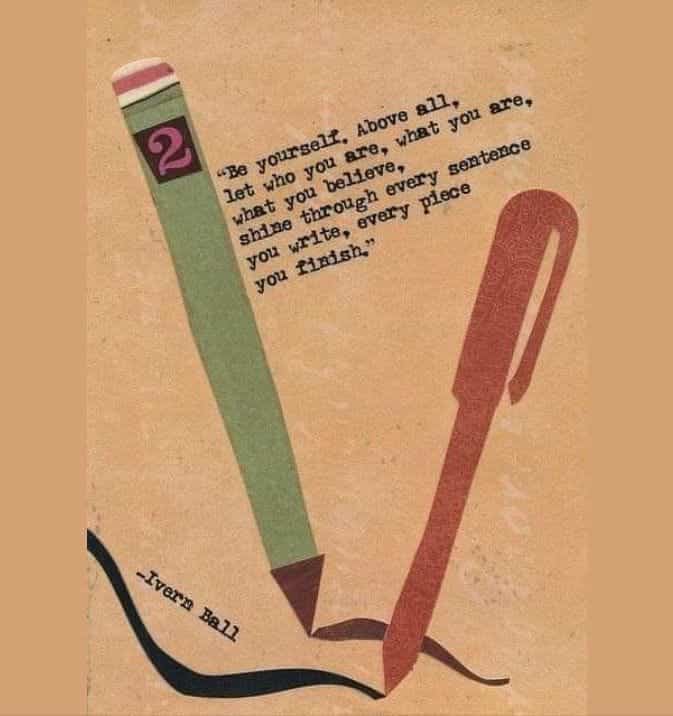

You need to travel the world. Any way you can. You need to get out there on the road. You need to look around you. You need to get lost. You need to ask yourself where I am going. You need to get out of your comfort zone. And only then there is a chance to meet again with yourself and get on better with your life. #mindstormGR
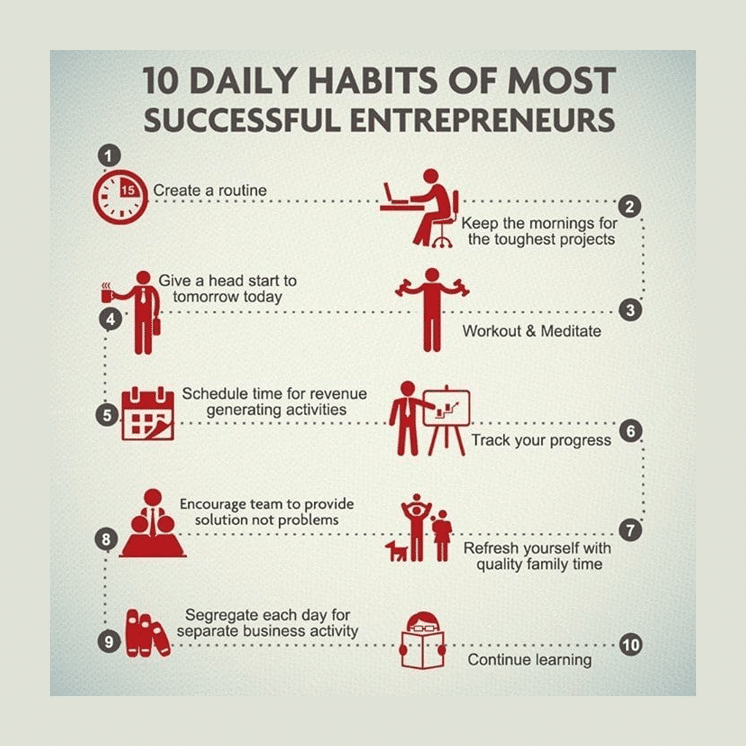
10 daily habits of most successful entrepreneurs / 10 συνήθειες που μπορεί να κάνουν τη διαφορά EN 1. Create a routine 2. Keep the mornings for the toughest projects 3. Give a head start to tomorrow today 4. Workout and meditate 5. Schedule time for revenue generating activities 6. Track your progress 7. Encourage team to provide solution not problems 8. Refresh yourself with quality family time 9. Segregate each day for separate business activity 10. Continue learning GR 1. Δημιούργησε μια ρουτίνα 2. Κράτα τα πρωινά για τα πιο απαιτητικά έργα 3. Δώσε ένα προβάδισμα στο αύριο από σήμερα 4. Γυμνάσου και κάνε διαλογισμό 5. Δώσε περισσότερο χρόνο σε δραστηριότητες που δημιουργούν έσοδα 6. Παρακολούθησε την πρόοδό σου 7. Ενθάρρυνε την ομάδα να προτείνει λύσεις και όχι προβλήματα 8. Αναζωογονήσου κάνοντας πράγματα με την οικογένεια 9. Αφιέρωσε κάθε μέρα σε μια ξεχωριστή επιχειρηματική δραστηριότητα 10. Συνέχισε να μαθαίνεις #work…

Medicine doesn’t end the story… Sometimes it starts a second illness “The person who takes medicine needs to recover twice. Once from the disease and once from the medicine.” That line came from Sir William Osler, one of the founders of modern medicine, and one of the “Big Four” founding professors of Johns Hopkins Hospital. And it should stop us cold. Because somewhere along the way, we accepted a strange bargain. We treat symptoms aggressively. We manage numbers. We suppress signals the body is sending. And then we quietly accept the side effects as the price of doing business. Fatigue. Weight gain. Blood sugar instability. Digestive damage. Nutrient depletion. New diagnoses that require new prescriptions. That second recovery Osler warned about has become invisible. Not because it disappeared. Because we normalized it. This is not an argument against medicine. It is an argument against pretending medicine is neutral. Food choices…
Dreams without goals are just dreams and ultimately they feel disappointment. On the road, to achieving your dreams you must apply discipline but more importantly, consistency because without commitment, you will never start. But without consistency, you never finish. View this post on Instagram A post shared by Law of Manifestation (@law_of_manifestation_777) https://www.instagram.com/reels/C3xbLHzgCqc/ Commitment and consistency Dreams without goals are like ships without a compass; they may sail aimlessly without a clear direction. While dreams fuel our aspirations and imagination, goals provide the roadmap to turn those dreams into reality. Without goals, dreams may remain as wishful thinking, lacking the concrete steps needed to achieve them. It’s the synergy between dreams and goals that propels individuals towards meaningful accomplishments.