ΠΡΑΚΤΙΚΟ TEST EXCEL #2 Το αρχείο περιλαμβάνει φύλλο «Δεδομένα» με πίνακα προϊόντων (Κόστος – Πωλήσεις) για να κάνεις τις ασκήσεις που θα δεις παρακάτω (μετά την εικόνα του αρχείου excel). 📥 Κατέβασε το αρχείο ✏️ ΑΣΚΗΣΕΙΣ Άσκηση 1 – Υπολογισμοί με Συναρτήσεις (10 μονάδες) Υπολόγισε: το σύνολο Πωλήσεων το σύνολο Κόστους Βρες: τη μέγιστη Πώληση την ελάχιστη Πώληση ➡️ Χρησιμοποίησε τις συναρτήσεις SUM, MAX, MIN. Άσκηση 2 – Μέσος Όρος (10 μονάδες) Υπολόγισε τον μέσο όρο Πωλήσεων όλων των προϊόντων με τη συνάρτηση AVERAGE. Άσκηση 3 – Υπολογισμός Περιθωρίου Κέρδους (Profit Margin) (10 μονάδες) Πρόσθεσε νέα στήλη Κέρδος Κέρδος = Πωλήσεις – Κόστος Πρόσθεσε στήλη Profit Margin (%) (Πωλήσεις – Κόστος) / Πωλήσεις Μορφοποίησε τη στήλη Profit Margin ως ποσοστό (%). Άσκηση 4 – Conditional Formatting (15 μονάδες) Εφάρμοσε Conditional Formatting στη στήλη Profit Margin: Τιμές πάνω από 40% → πράσινο χρώμα Τιμές κάτω από 30% → κόκκινο χρώμα Άσκηση…
Clustering Classification Problem Το Clustering και το Classification είναι δύο βασικά προβλήματα της Μηχανικής Μάθησης, με τη βασική τους διαφορά να είναι το αν υπάρχουν ή όχι προκαθορισμένες ετικέτες. Το Clustering είναι πρόβλημα μη επιβλεπόμενης μάθησης, όπου στόχος είναι να ομαδοποιηθούν δεδομένα σε ομάδες (clusters) με βάση την ομοιότητά τους, χωρίς να γνωρίζουμε εκ των προτέρων τις κατηγορίες· χρησιμοποιείται κυρίως για την ανακάλυψη προτύπων και δομής στα δεδομένα. Αντίθετα, το Classification Problem είναι πρόβλημα επιβλεπόμενης μάθησης, όπου κάθε παρατήρηση ανήκει σε μια γνωστή κλάση και ο στόχος είναι να εκπαιδευτεί ένα μοντέλο που, με βάση χαρακτηριστικά εισόδου, προβλέπει σωστά την κατηγορία στην οποία ανήκει ένα νέο δείγμα. Μια μεγάλη υπηρεσία streaming (τύπου Netflix) συλλέγει δεδομένα θέασης από 5.000.000 χρήστες. Για λόγους άσκησης, δίνεται παρακάτω μικρό υποσύνολο δεδομένων από 12 χρήστες: Χρήστης Είδος ταινιών που παρακολουθεί Μέσος χρόνος θέασης (λεπτά/ημέρα) Προτιμώμενη συσκευή Συνδρομή Κατηγορία Χρόνου 1 Action, Sci-Fi 150 TV Premium…
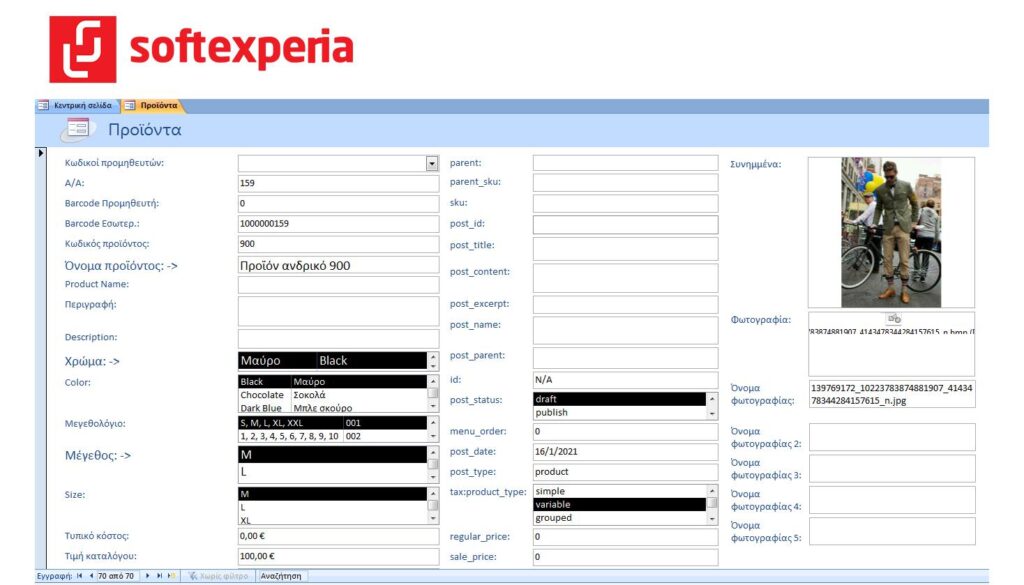
Θα θέλατε να βλέπετε τα προϊόντα σας σε μια φόρμα με όλες τις απαραίτητες πληροφορίες αλλά και με – barcode προμηθευτή -> Πεδίο : “Barcode Προμηθευτή” – αυτόματη δημιουργία barcode εταιρείας -> Πεδίο : “Barcode Εσωτερ.” – ανάλυση χρωμάτων -> Πεδίο : “Χρώμα” – ανάλυση μεγεθών -> Πεδίο : “Μέγεθος” – πολλά συνημμένα έγγραφα (φωτογραφίες, αντίγραφα τιμολογίων αγοράς, τεχνικές πληροφορίες κ.α.) – > Πεδίο : “Συνημμένα” – φωτογραφία – > Πεδίο : “Φωτογραφία” – Όνομα φωτογραφίας -> Πεδίο : “‘Όνομα Φωτογραφίας” – Όνομα φωτογραφίας 2 -> Πεδίο : “‘Όνομα Φωτογραφίας 2” – Όνομα φωτογραφίας 3 -> Πεδίο : “‘Όνομα Φωτογραφίας 3” – Όνομα φωτογραφίας 4 -> Πεδίο : “‘Όνομα Φωτογραφίας 4” – Όνομα φωτογραφίας 5 -> Πεδίο : “‘Όνομα Φωτογραφίας 5” Θα θέλατε να βλέπετε αυτές τις φωτογραφίες χωρίς να χρειάζεται να βγείτε από το πρόγραμμα; Μήπως μια τέτοια εφαρμογή είναι απαραίτητη για να ετοιμάσετε τα προϊόντα σας για εισαγωγή…
Θεματικές: SUM, MIN, MAX, AVERAGE, Profit Margin, Conditional Formatting, VLOOKUP, Table Formatting, Background Formatting, Graphs 🧮 Ερωτήσεις Πολλαπλής Επιλογής – Excel (1–30) 1. Ποια είναι η σωστή συνάρτηση για να υπολογίσουμε το άθροισμα των κελιών A1 έως A10; A. =ADD(A1:A10) B. =TOTAL(A1:A10) C. =SUM(A1:A10) D. =COUNT(A1:A10) ________________________________________ 2. Ποια συνάρτηση χρησιμοποιούμε για να βρούμε τη μικρότερη τιμή σε ένα εύρος κελιών; A. =LOW(A1:A10) B. =MIN(A1:A10) C. =SMALL(A1:A10) D. =LESS(A1:A10) ________________________________________ 3. Ποια συνάρτηση επιστρέφει τη μεγαλύτερη τιμή ενός εύρους; A. =MAX(A1:A10) B. =HIGH(A1:A10) C. =TOP(A1:A10) D. =LARGE(A1:A10) ________________________________________ 4. Ποια συνάρτηση χρησιμοποιούμε για να υπολογίσουμε τον μέσο όρο αριθμών; A. =MEAN(A1:A10) B. =AVERAGE(A1:A10) C. =MID(A1:A10) D. =AVG(A1:A10) ________________________________________ 5. Τι κάνει το Conditional Formatting στο Excel; A. Αλλάζει αυτόματα τους τύπους B. Υπολογίζει αριθμητικές πράξεις C. Μορφοποιεί κελιά βάσει κανόνων D. Δημιουργεί γραφήματα ________________________________________ 6. Ποιος είναι ο σωστός τύπος για τον υπολογισμό του περιθωρίου κέρδους (Profit Margin); (Κέρδος =…
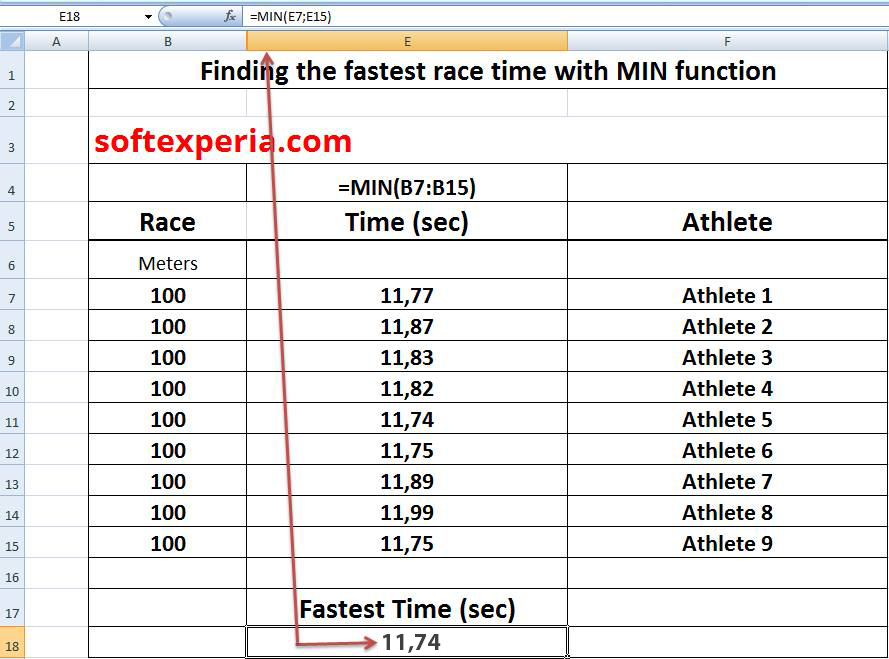
Finding the fastest race time with MIN function softexperia.com Type for cell E18 =MIN(B7:B15) Race Time (sec) Athlete 100 11,77 Athlete 1 100 11,87 Athlete 2 100 11,83 Athlete 3 100 11,82 Athlete 4 100 11,74 Athlete 5 100 11,75 Athlete 6 100 11,89 Athlete 7 100 11,99 Athlete 8 100 11,75 Athlete 9 Fastest Time (sec) 11,74 #excel_tips #calculations #softexperia
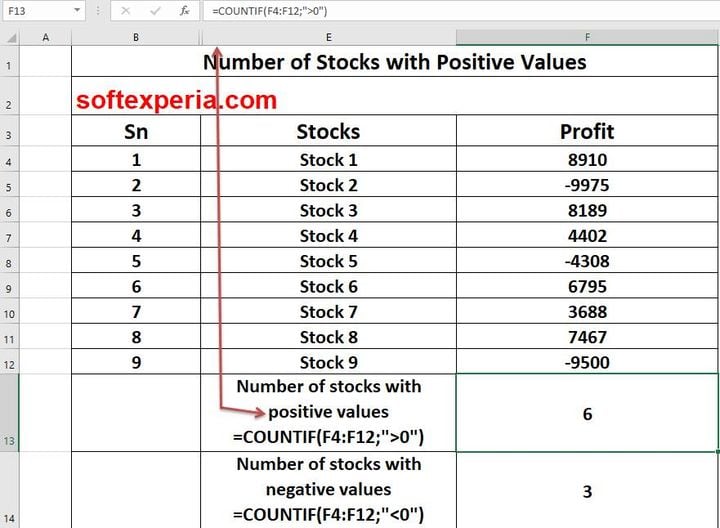
Number of Stocks with Positive Values Sn Stocks Profit 1 Stock 1 8910 2 Stock 2 -9975 3 Stock 3 8189 4 Stock 4 4402 5 Stock 5 -4308 6 Stock 6 6795 7 Stock 7 3688 8 Stock 8 7467 9 Stock 9 -9500 Number of stocks with positive values F13=COUNTIF(F4:F12;”>0″) 6 Number of stocks with negative values F14=COUNTIF(F4:F12;”<0″) 3 #excel_tips #softexperia
📊 Excel Skills Assessment Quiz Test your Excel knowledge and see how you perform. This interactive quiz evaluates your understanding of core Excel concepts, including formulas, functions, cell references, and logical operations. You’ll answer a set of multiple-choice questions and receive immediate feedback along with a visual summary of your results. After completing the quiz, you will: ✅ See your score and skill level📋 Review your answers alongside the correct ones📊 View a visual breakdown of correct and incorrect responses⏱️ See the time it took you to complete the quiz📄 Download your results as a PDF for future reference Whether you’re a beginner or refreshing your Excel fundamentals, this quiz provides a quick and clear assessment of your current skill level. 👉 Start the Excel Quiz when you’re ready — your completion time will be recorded automatically. Excel Quiz
Η συνάρτηση XLOOKUP στο Excel είναι μια ισχυρή και ευέλικτη συνάρτηση αναζήτησης που χρησιμοποιείται για να βρει μια τιμή σε μια στήλη ή γραμμή και να επιστρέψει μια αντίστοιχη τιμή από μια άλλη στήλη ή γραμμή. Είναι πιο σύγχρονη και ευκολότερη στη χρήση από τις παλαιότερες συναρτήσεις αναζήτησης, όπως η VLOOKUP και η HLOOKUP. Σύνταξη της XLOOKUP: XLOOKUP(αναζητούμενη_τιμή, πίνακας_αναζήτησης, πίνακας_επιστροφής, [αν_μη_βρεθεί, [ταξινόμηση]]) – **αναζητούμενη_τιμή**: Η τιμή που θέλουμε να βρούμε. – **πίνακας_αναζήτησης**: Η περιοχή όπου θα ψάξουμε για την αναζητούμενη τιμή. – **πίνακας_επιστροφής**: Η περιοχή από την οποία θα επιστραφεί η αντίστοιχη τιμή. – **αν_μη_βρεθεί**: (προαιρετικό) Η τιμή που θα επιστραφεί αν δεν βρεθεί η αναζητούμενη τιμή. – **ταξινόμηση**: (προαιρετικό) Ορίζει αν η αναζήτηση θα είναι ακριβής ή κατά προσέγγιση. Παράδειγμα: Ας υποθέσουμε ότι έχουμε έναν πίνακα με ονόματα και ηλικίες: | Όνομα | Ηλικία | |——–|——–| | Γιάννης| 25 | | Μαρία | 30 | | Κώστας | 22 …
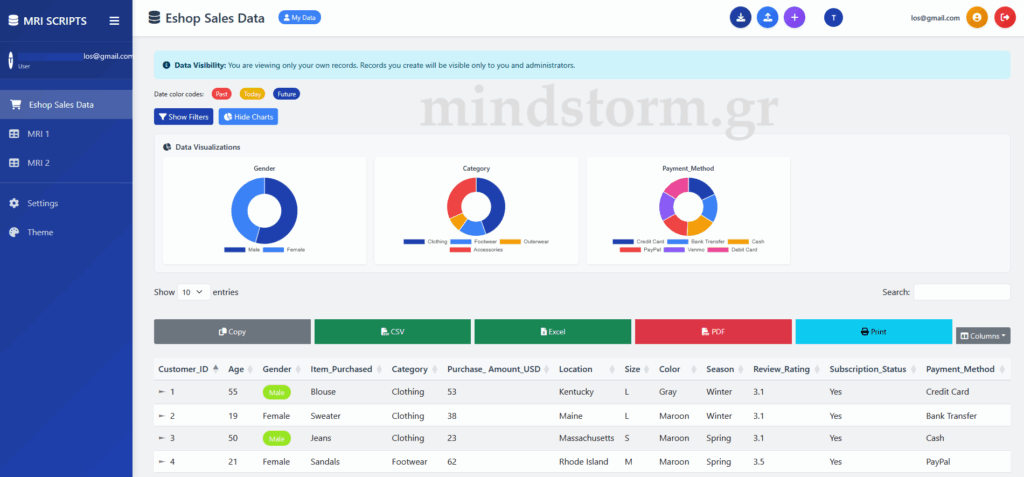
EN – Unlock the Power of Your Sales Data Modern. Insightful. Effortless. Transform the way your company understands its customers with the E-Shop Sales Data Dashboard—a beautifully designed analytics solution that turns every transaction into meaningful insights. Discover What Drives Your Business Get instant clarity with real-time visualizations that reveal: Who your customers are What they buy How they pay Which products perform best Interactive doughnut and pie charts give you a vibrant snapshot of your store’s performance—no spreadsheets, no manual work. Make Smarter, Faster Decisions With a powerful filtering engine, you can drill down into any detail: Sort by dates, customer attributes, or product categories Highlight trends with intuitive color-coded timelines Instantly reveal hidden opportunities and patterns Your data—organized, simplified, and ready for action. Export & Share with One Click Whether you’re presenting to stakeholders or analyzing weekly results, exporting has never been easier.Generate reports in: CSV Excel PDF…
Η δημιουργία ενός ερωτηματολογίου όπως και η ανάλυση των συμπληρωμένων απαντήσεων είναι μια δουλειά που θέλει ιδιαίτερη προσοχή. Γιατί πρώτον, η σωστή σύνταξη των ερωτήσεων βοηθά στην εύκολη συμπλήρωση των απαντήσεων από το κοινό και δεύτερον, η ανάλυση των απαντήσεων αυξάνει τις πιθανότητες επιτυχίας των μετέπειτα επιχειρηματικών επιλογών μας. Δείτε παρακάτω ένα ερωτηματολόγιο σχετικά με την κατανάλωση οίνου το οποίο μπορεί να διατεθεί σε τυχαίο δείγμα μιας γεωγραφικής περιοχής (διαφόρων ηλικιών και ποικίλων οικονομικών κατηγοριών). Ενδεικτικός αριθμός ατόμων : 100 Ενδεικτικός χρόνος συμπλήρωσης : 2-4 λεπτά χωρίς τη βοήθεια άλλου προσώπου. Με την ολοκλήρωση των ερωτηματολογίων γίνεται ανάλυση των απαντήσεων με τη βοήθεια κατάλληλου λογισμικού ή υπολογιστικών φύλλων. Ερωτηματολόγιο A.Προσωπικά στοιχεία 1.Φύλο Άνδρας Γυναίκα 2.Ηλικία < 18 18-24 25-40 41-65 >65 3.Οικογενειακή κατάσταση Άγαμος Έγγαμος Έγγαμος με τέκνα 4.Μορφωτικό επίπεδο Δευτεροβάθμια εκπαίδευση ΙΕΚ ΑΕΙ ΤΕΙ Μεταπτυχιακός τίτλος Διδακτορικό 5.Τόπος διαμονής Χωριό Κωμόπολη Πόλη 6.Απασχόληση Δημόσιο Ιδιωτικός τομέας Ελεύθερος επαγγελματίας 7.Ετήσιο…
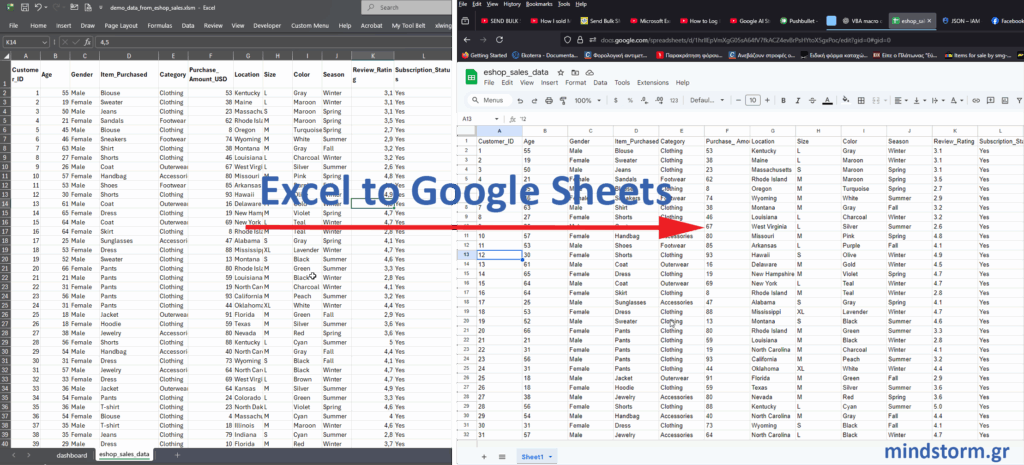
Excel to Google Sheets Filename : C:\PythonPrograms\excel_to_google_sheets_with_python\demo_data_from_eshop_sales.xlsm Python script # copy_excel_to_googlesheets.py import pandas as pd from googleapiclient.discovery import build from google.oauth2.service_account import Credentials # ——————— # CONFIG # ——————— excel_file = “demo_data_from_eshop_sales.xlsm” sheet_name = “eshop_sales_data” google_sheet_id = “GOOGLE SHEET ID” credentials_file = “service_account.json” # ——————— # LOAD EXCEL (reads only used rows) # ——————— print(” Loading Excel file…”) df = pd.read_excel(excel_file, sheet_name=sheet_name) # Remove completely empty rows (just in case) df.dropna(how=”all”, inplace=True) # Replace NaN with empty strings (Google API requirement) df = df.fillna(“”) print(” Authenticating with Google…”) # ——————— # AUTHENTICATE # ——————— creds = Credentials.from_service_account_file( credentials_file, scopes=[“https://www.googleapis.com/auth/spreadsheets”] ) service = build(“sheets”, “v4″, credentials=creds) print(” Preparing data for upload…”) # ——————— # PREPARE DATA FOR GOOGLE SHEETS # ——————— values = [df.columns.tolist()] + df.astype(str).values.tolist() print(” Clearing existing Google Sheet data…”) # ——————— # CLEAR SHEET # ——————— service.spreadsheets().values().clear( spreadsheetId=google_sheet_id, range=”A1:Z15000″ ).execute()…
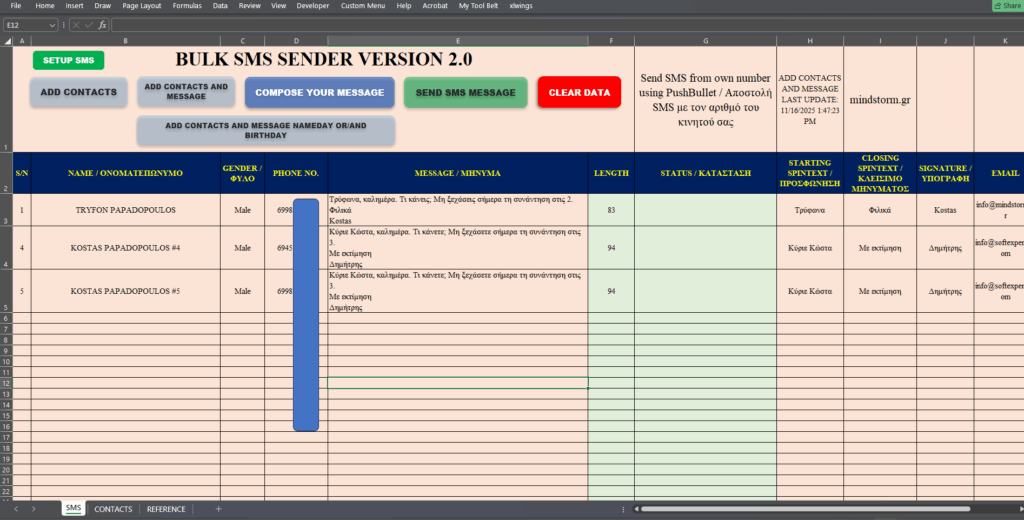
Bulk SMS Sender 2.0 – Αυτοματοποιημένες Ευχές & Μηνύματα από Excel με το δικό σας κινητό Ανάπτυξα ένα έξυπνο σύστημα στο Excel που δημιουργεί αυτόματα προσωπικά SMS για γιορτές, γενέθλια, εκδηλώσεις και υπενθυμίσεις, με χρήση VBA.Το εργαλείο: ✔ Εντοπίζει ποιοι έχουν γιορτή ή γενέθλια σήμερα✔ Στέλνει μηνύματα μόνο σε όσους έχουν επιλεγεί ως “Include to send”✔ Δημιουργεί πλήρως προσωποποιημένα μηνύματα (προσφώνηση, κείμενο, κλείσιμο, υπογραφή)✔ Συνδυάζει γιορτή + γενέθλια όταν συμπίπτουν✔ Προετοιμάζει αυτόματα τα SMS για μαζική αποστολή μέσω κινητού Ένα ολοκληρωμένο εργαλείο για επαγγελματίες που θέλουν αυτοματοποίηση και εξοικονόμηση χρόνου στην επικοινωνία με πελάτες και συνεργάτες. Filename : BULK SMS SENDER APP2.xlsm Τι κάνει ο κώδικας VBA στο Bulk SMS Sender 2.0 Ο κώδικας VBA που χρησιμοποιείται στο αρχείο Bulk SMS Sender 2.0 αυτοματοποιεί πλήρως τη διαδικασία επιλογής επαφών και δημιουργίας προσωποποιημένων SMS μηνυμάτων, με βάση συγκεκριμένα κριτήρια. Πιο αναλυτικά: ✅ 1. Ελέγχει ποιοι παραλήπτες πρέπει να λάβουν μήνυμα Ο…
Μελλοντική αξία (FV) ενός σημερινού ποσού Παρούσα αξία (PV) ενός μελλοντικού ποσού Παράδειγμα Μελλοντικής Αξίας (Future Value – FV) Σενάριο: Έχεις σήμερα 5.000 € και τα καταθέτεις σε μια τράπεζα με ετήσιο επιτόκιο 4%, για 5 χρόνια, με ετήσιο ανατοκισμό. Θέλεις να βρεις: Πόσα θα έχεις στο τέλος των 5 ετών; Βήμα 1: Γράφουμε τα δεδομένα Παρούσα αξία (PV) = 5.000 € Επιτόκιο (r) = 4% = 0,04 Περίοδοι (n) = 5 έτη Ζητούμενο: Μελλοντική αξία (FV) Βήμα 2: Τύπος μελλοντικής αξίας Βήμα 3: Αντικαθιστούμε τα δεδομένα Βήμα 4: Ερμηνεία Αν επενδύσεις 5.000 € σήμερα με επιτόκιο 4% για 5 χρόνια, στο τέλος θα έχεις περίπου 6.083,26 €. Η διαφορά 6.083,26 – 5.000 = 1.083,26 € είναι οι τόκοι που κέρδισες συνολικά (και περιλαμβάνουν και τον ανατοκισμό). Παράδειγμα Παρούσας Αξίας (Present Value – PV) Σενάριο: Σου υπόσχονται ότι θα λάβεις 10.000 € σε 3 χρόνια. Το κατάλληλο προεξοφλητικό επιτόκιο (δηλαδή…
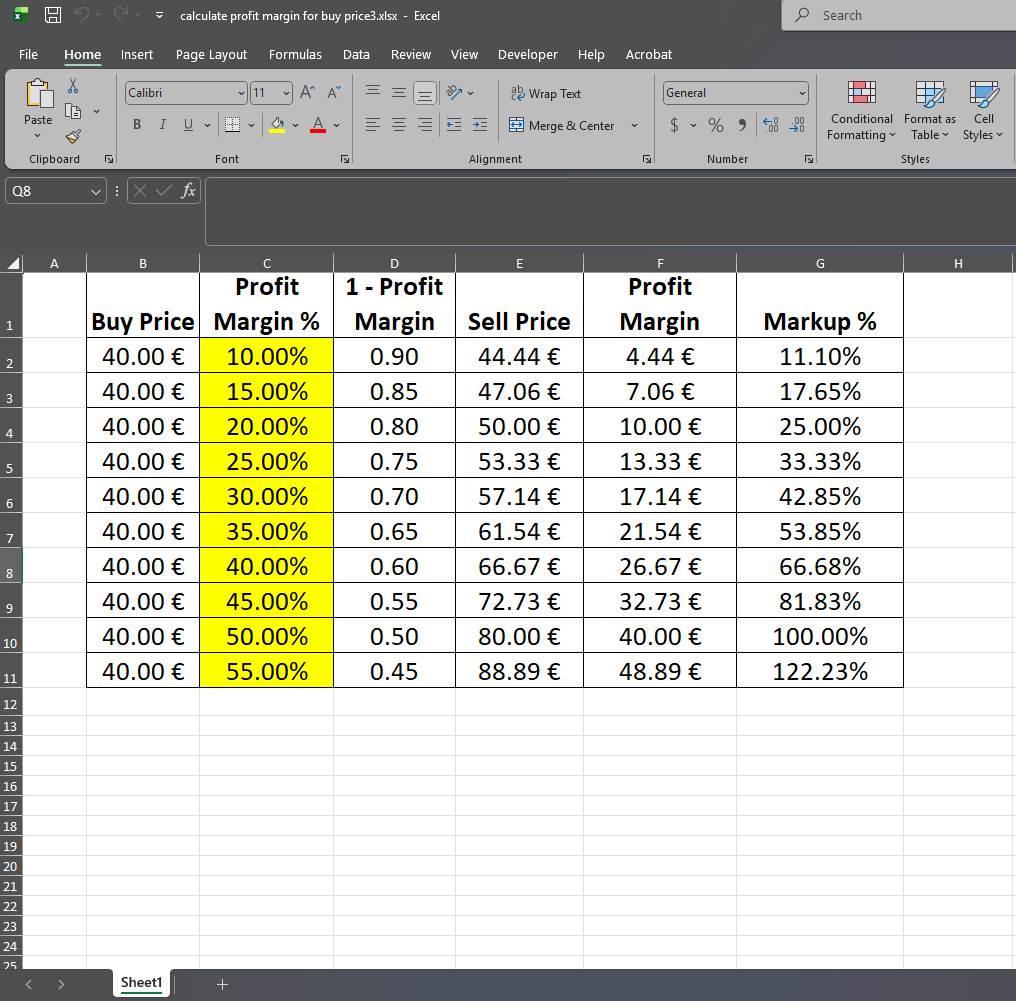
✅ Understanding Profit Margin, Markup, and Selling Price (With Example Table) When you run a business, knowing how to correctly price your products is essential. Two of the most common pricing metrics are profit margin and markup. Although people often mix them up, they are not the same thing. Let’s break it down using the example above, where every product has a €40.00 buy cost. ✅ 1. Profit Margin % Profit margin shows how much profit you earn as a percentage of the selling price. Example: Buy Price: €40.00 Profit Margin: 25% Sell Price becomes €53.33 Profit earned: €13.33 Formula: Sell Price = Buy Price / (1 − Profit Margin) ✅ 2. Sell Price This is the final price you charge the customer after applying the profit margin. You can see how the selling price increases as the margin goes up. Example: 10% margin → €44.44 selling price 40% margin…
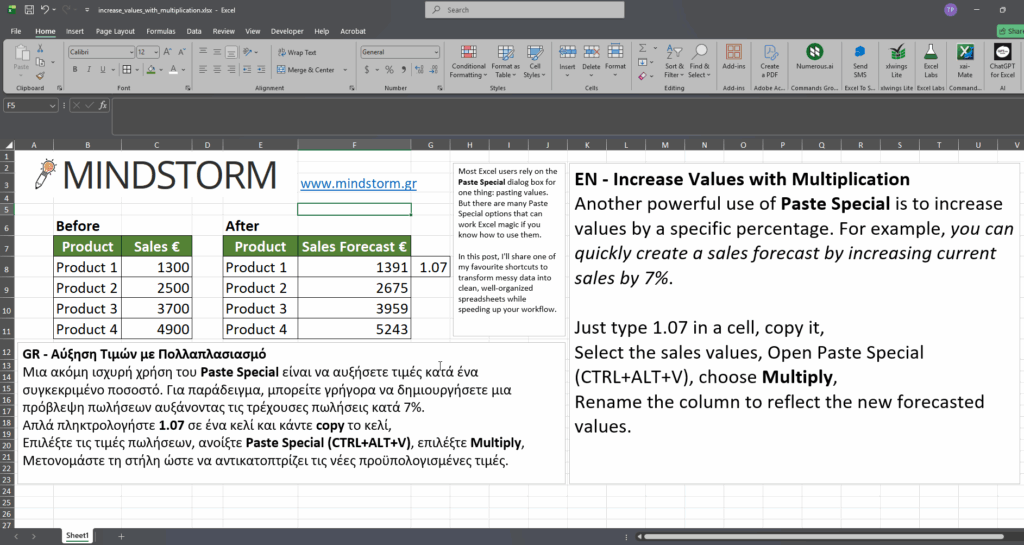
Most Excel users rely on the Paste Special dialog box for one thing: pasting values. But there are many Paste Special options that can work Excel magic if you know how to use them. In this post, I’ll share one of my favourite shortcuts to transform messy data into clean, well-organized spreadsheets while speeding up your workflow. EN – Increase Values with Multiplication Another powerful use of Paste Special is to increase values by a specific percentage. For example, you can quickly create a sales forecast by increasing current sales by 7%. Just type 1.07 in a cell, copy it, Select the sales values, Open Paste Special (CTRL+ALT+V), choose Multiply, Rename the column to reflect the new forecasted values. GR – Αύξηση Τιμών με Πολλαπλασιασμό Μια ακόμη ισχυρή χρήση του Paste Special είναι να αυξήσετε τιμές κατά ένα συγκεκριμένο ποσοστό. Για παράδειγμα, μπορείτε γρήγορα να δημιουργήσετε μια πρόβλεψη πωλήσεων αυξάνοντας…
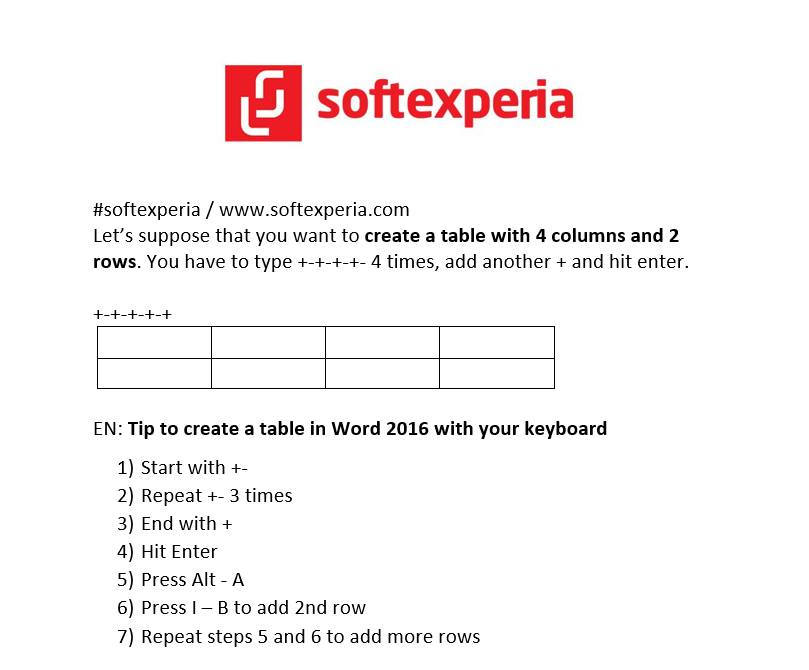
#softexperia / www.softexperia.com Let’s suppose that you want to create a table with 4 columns and 2 rows in Word. You have to type +-+-+-+- 4 times, add another + and hit enter. +-+-+-+-+ EN: Tip to create a table in Word 2016 with your keyboard 1) Start with +- 2) Repeat +- 3 times 3) End with + 4) Hit Enter 5) Press Alt – A 6) Press I – B to add 2nd row 7) Repeat steps 5 and 6 to add more rows GR: Συνδυασμός πλήκτρων για να δημιουργήσεις γρήγορα έναν πίνακα στο Word 2016 1) Ξεκίνα με +- 2) Πρόσθεσε +- 3 φορές 3) Τελείωσε με + 4) Πάτησε το Enter 5) Πάτησε το συνδυασμό πλήκτρων Alt – A για να μαρκάρεις την 1η γραμμή του πίνακα 6) Πάτησε το συνδυασμό πλήκτρων I – B για να προσθέσεις 2η γραμμή 7) Επανέλαβε τα βήματα 5 και…
Create 4 Pivot Tables with a button (VBA) Sales Data Analysis Total Sales by Country Total Sales by Salesperson Total Sales by Customer Total Sales by Product Category Facebook video: https://www.facebook.com/trifon.papadopoulos.5/videos/1071587840499690 #vba #data_analysis #excel_tips #mindstormGR / www.mindstorm.gr


