Παράγοντες που επηρεάζουν την τιμολόγηση Εισαγωγή στην Τιμολόγηση Η τιμολόγηση αποτελεί μία από τις πιο κρίσιμες αποφάσεις στο μίγμα μάρκετινγκ. Επηρεάζει άμεσα τα έσοδα, την αντίληψη των πελατών για το προϊόν, αλλά και τη θέση της επιχείρησης στην αγορά. Η κατάλληλη τιμή μπορεί να ενισχύσει την ανταγωνιστικότητα, ενώ μια κακή τιμολόγηση μπορεί να οδηγήσει σε απώλεια πελατών ή κερδοφορίας. Εσωτερικοί Παράγοντες Τιμολόγησης Οι εσωτερικοί παράγοντες σχετίζονται με την ίδια την επιχείρηση και τις δυνατότητές της. 2.1 Κόστος Παραγωγής Το κόστος είναι η βάση για τον καθορισμό της τιμής. Κόστος πρώτων υλών Κόστος εργασίας Γενικά βιομηχανικά κόστη Κόστος διανομής και logistics Η επιχείρηση πρέπει να καλύπτει τα κόστη της και να εξασφαλίζει κέρδος. Διαφορετικά, η τιμή δεν είναι βιώσιμη. 2.2 Στόχοι της Επιχείρησης Ανάλογα με το στρατηγικό της προσανατολισμό, η επιχείρηση μπορεί να επιδιώκει: Μέγιστη κερδοφορία Αύξηση μεριδίου αγοράς Επιβίωση σε ανταγωνιστικό περιβάλλον Τοποθέτηση ως premium προϊόν 2.3 Στρατηγική Μάρκετινγκ Η…
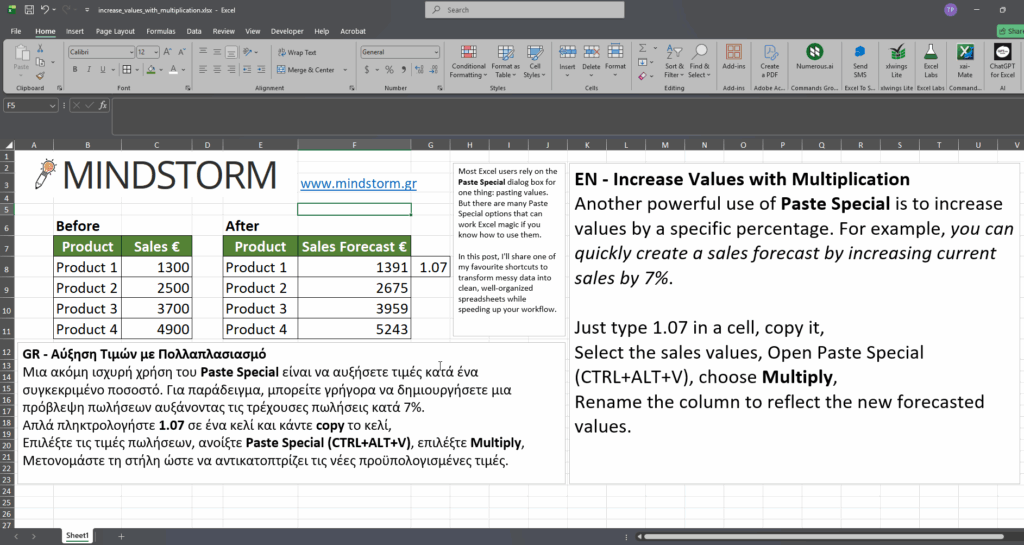
Most Excel users rely on the Paste Special dialog box for one thing: pasting values. But there are many Paste Special options that can work Excel magic if you know how to use them. In this post, I’ll share one of my favourite shortcuts to transform messy data into clean, well-organized spreadsheets while speeding up your workflow. EN – Increase Values with Multiplication Another powerful use of Paste Special is to increase values by a specific percentage. For example, you can quickly create a sales forecast by increasing current sales by 7%. Just type 1.07 in a cell, copy it, Select the sales values, Open Paste Special (CTRL+ALT+V), choose Multiply, Rename the column to reflect the new forecasted values. GR – Αύξηση Τιμών με Πολλαπλασιασμό Μια ακόμη ισχυρή χρήση του Paste Special είναι να αυξήσετε τιμές κατά ένα συγκεκριμένο ποσοστό. Για παράδειγμα, μπορείτε γρήγορα να δημιουργήσετε μια πρόβλεψη πωλήσεων αυξάνοντας…
Η συνάρτηση FILTER στο Excel χρησιμοποιείται για να φιλτράρει δεδομένα από μια περιοχή (range) με βάση συγκεκριμένα κριτήρια. Επιστρέφει μόνο τις γραμμές που πληρούν τις προϋποθέσεις που ορίζουμε. # Σύνταξη “`excel FILTER(array, include, [if_empty]) “` – array: Η περιοχή δεδομένων που θέλουμε να φιλτράρουμε. – include: Τα κριτήρια που καθορίζουν ποιες γραμμές θα συμπεριληφθούν. – if_empty: (προαιρετικό) Η τιμή που θα επιστραφεί αν δεν υπάρχουν αποτελέσματα. # Παράδειγμα Ας υποθέσουμε ότι έχουμε μια λίστα με πωλήσεις προϊόντων: | Προϊόν | Πωλήσεις | |———|———-| | Μήλα | 100 | | Πορτοκάλια | 150 | | Μπανάνα | 120 | | Μήλα | 200 | Αν θέλουμε να φιλτράρουμε μόνο τις πωλήσεις των Μηλών, θα χρησιμοποιήσουμε τη συνάρτηση FILTER ως εξής: “`excel =FILTER(A2:B5, A2:A5=”Μήλα”, “Δεν υπάρχουν αποτελέσματα”) “` Αυτό θα επιστρέψει: | Προϊόν | Πωλήσεις | |——–|———-| | Μήλα | 100 | | Μήλα | 200 | # Χρήσεις 1. Ανάλυση δεδομένων:…
The FILTER function in Excel is used to extract a subset of data from a range based on specified criteria. It allows you to filter rows that meet certain conditions, making it easier to analyze specific data without altering the original dataset. # Syntax: “`excel FILTER(array, include, [if_empty]) “` – array: The range of data you want to filter. – include: A logical condition that determines which rows to include. – if_empty: (optional) The value to return if no rows meet the criteria. # Example: Suppose you have the following data in cells A1:B5: | Name | Score | |——-|——-| | John | 85 | | Jane | 90 | | Mike | 75 | | Anna | 95 | If you want to filter out students who scored above 80, you can use the following formula: “`excel =FILTER(A2:B5, B2:B5 > 80, “No results”) “` This will return: | Name…
Η συνάρτηση VLOOKUP στο Excel (Vertical Lookup) χρησιμοποιείται για να αναζητήσει μια τιμή σε μια στήλη ενός πίνακα και να επιστρέψει μια αντίστοιχη τιμή από μια άλλη στήλη του ίδιου πίνακα. Είναι πολύ χρήσιμη για την αναζήτηση δεδομένων. # Σύνταξη της VLOOKUP: “` VLOOKUP(τιμή_αναζήτησης, πίνακας, αριθμός_στήλης, [εύρος_αντιστοίχισης]) “` – τιμή_αναζήτησης: Η τιμή που θέλουμε να βρούμε. – πίνακας: Ο πίνακας δεδομένων όπου θα γίνει η αναζήτηση. – αριθμός_στήλης: Ο αριθμός της στήλης από την οποία θέλουμε να επιστρέψουμε την τιμή (η πρώτη στήλη είναι 1). – εύρος_αντιστοίχισης: Προαιρετικό. Αν είναι TRUE ή παραλειφθεί, η VLOOKUP θα επιστρέψει την πλησιέστερη τιμή. Αν είναι FALSE, θα επιστρέψει μόνο ακριβείς αντιστοιχίες. # Παράδειγμα: Ας υποθέσουμε ότι έχουμε τον παρακάτω πίνακα με ονόματα και ηλικίες: | Όνομα | Ηλικία | |———|——–| | Γιάννης | 25 | | Μαρία | 30 | | Κώστας | 22 | Αν θέλουμε να βρούμε την ηλικία του “Μαρία”,…
Functions UPPER, LOWER, TRIM & PROPER See Columns Customer Before and Customer After / Δείτε τις στήλες Customer Before και Customer After View large image : https://lnkd.in/d6qV-GqD Download excel file “sales_feb_2021_a_functions.xlsx” : https://lnkd.in/dkYSGJjy #excel_tips #excel_calculations #softexperia / www.softexperia.com
Sum of Sales per Customer / Άθροισμα πωλήσεων ανά πελάτη How the SUMIF Function Works (With Screenshot Callouts) The SUMIF function in Excel lets you add values that meet a specific condition.In this example, it is used to calculate the total sales per customer. 📌 Callout 1: The Raw Data (Left Side of the Image) 👉 Look at the left side of the screenshot Column A shows Customer names Column B shows Sales amounts Some customers appear multiple times, because they made more than one purchase This is typical sales data that is not yet summarized. 📌 Callout 2: The Summary Table (Highlighted in Red) 👉 Look at the red highlighted area in the screenshot This section shows: One row per customer The total sales amount for each customer This is the result we want to calculate automatically using Excel. 📌 Callout 3: The SUMIF Formula (Right Side, Yellow Cells)…
Mini Calendar and Date Picker – Excel Tips Add a mini monthly calendar to your spreadsheet and use it to insert dates or the current time. Embed a small monthly calendar into your spreadsheet for reference and entering dates. This app for Excel is particularly useful for working with time sheets, schedules, project plans, logs, and ledgers where you frequently need to refer to a calendar. The date picking function makes it easy to enter dates or the current time into the currently selected cell. You can highlight dates in the calendar by selecting a range of dates in your spreadsheet. You can also toggle the size of the calendar, show week numbers, change the calendar system (U.S. or ISO), and choose a different theme (blue, green, etc.). Music track: A Positive Direction by Aylex Source: https://freetouse.com/music Royalty Free Music for Video (Safe) Facebook link: https://www.facebook.com/reel/546852667568094 #excel_tips #calendar #mindstormGR #productivity
This table and explanation provide a breakdown of invoices and customers based on specific conditions like date range, status, and city. Here’s the detailed explanation: Input Conditions Start Date: January 3, 2022 End Date: February 14, 2022 Status: Paid City: Athens These conditions filter the data to only include invoices and customers: Within the date range from 1/3/2022 to 2/14/2022. Having the status “Paid.” (For customers) belonging to Athens city. Metrics Calculated Count of Invoices (Start Date, End Date, Status): 3 Formula: =SUM((Date>=C3)*(Date<=D3)*(Status=E3)) Filters rows where the Date is between 1/3/2022 and 2/14/2022 and Status = Paid. From the table: Reese Withpoon (1/24/2022, Paid) Clint Eastwood (2/14/2022, Paid) Kanye East (1/18/2022, Paid — excluded from “City: Athens” but counted here). Sum of Invoices (Start Date, End Date, Status): 934 Formula: =SUM((Date>=C3)*(Date<=D3)*(Status=E3)*Amount) Sums the Amount for invoices where the conditions above are true. Breakdown: Reese Withpoon: 279 Clint Eastwood: 231 Kanye…
The table provided explains how to use INDEX and MATCH functions to retrieve specific values based on a selected Product ID. Here’s a breakdown of the setup: Table Layout Columns: Product ID, Product Sales Value, Product Category, Product Description, and Sales Person. User Input: The user selects a Product ID (e.g., 7 in cell H8). Goal: Display the corresponding data (Sales Value, Category, Description, and Sales Person) in separate cells based on the selected Product ID. Explanation of the Formulas Each formula retrieves data from a specific column of the table using a combination of INDEX and MATCH. Formula for Product Sales Value (I8) =INDEX($F$8:$F$14;MATCH(H8;$A$8:$A$14;0)) $F$8:$F$14: The range containing the Product Sales Value. MATCH(H8;$A$8:$A$14;0): H8 contains the selected Product ID (e.g., 7). $A$8:$A$14 is the range of Product IDs. MATCH finds the row where H8 matches a value in $A$8:$A$14. INDEX uses the row number from MATCH to return the…
Common Marketing Problems in the Food Industry Customer Awareness and Brand Recognition: Many food brands struggle with building customer awareness and brand recognition, especially in highly competitive markets. Challenge: How to differentiate the brand and make it stand out among competitors. Possible Scenario: Low customer engagement, low social media interaction, and low brand recall. Pricing Strategy: Determining the right pricing strategy can be tricky, especially with the fluctuating costs of ingredients and the pressure from competitors. Challenge: Balancing between competitive pricing and maintaining profit margins. Possible Scenario: Competitor price drops, increases in production costs, or demand sensitivity to pricing. Product Distribution and Reach: Ensuring that products reach the target market efficiently is crucial, and many companies face issues with distribution logistics. Challenge: Expanding distribution channels while managing logistics costs and maintaining product quality. Possible Scenario: Limited shelf space, issues with supply chain efficiency, or new market entry. Changing Consumer Preferences:…
List of files in Excel and preview of images – VBA Code – Excel 1) Is it possible to have a list of the images found in a folder and its subfolders in Excel? 2) Is it possible to see the images as I move from one row to another? 3) Is it possible to see the actual image, its name and other info as I scroll down? 4) Is it possible to rename images in source folder according to a rule such as Last Subfolder & ID & FileName, and then copy all renamed images to another folder (target folder)? 5) Is it possible to have all images as they were in the source folder? Yes, it is. Check this video on YouTube and watch it happening. VBA Code credit : Trifon Papadopoulos #mindstormGR #list_of_images_in_excel Δείτε επίσης Import of multiple posts to WordPress with the use of Excel, Word…
Calculate the days of work between two dates with the NETWORKDAYS function Start Date: 15/5/2020 End Date: 28/1/2021 Holiday 1: 26/8/2020 Holiday 2: 18/11/2020 Holiday 3: 15/1/2021 Calculate the days between two dates with the NETWORKDAYS function excluding Holiday 1, Holiday 2 and Holiday 3. Saturday and Sunday are omitted. Result Number of days between the two dates: 182 — This image demonstrates how to calculate the number of working days between two dates in Excel using the NETWORKDAYS function. It excludes weekends (Saturday and Sunday) and specific holidays listed. The formula shown, =NETWORKDAYS(C3, C4, C5:C7), returns 182 working days between May 15, 2020 and January 28, 2021, excluding three holidays. Αυτή η εικόνα δείχνει πώς να υπολογίσετε τον αριθμό των εργάσιμων ημερών μεταξύ δύο ημερομηνιών στο Excel, χρησιμοποιώντας τη συνάρτηση NETWORKDAYS. Η συνάρτηση εξαιρεί τα Σαββατοκύριακα (Σάββατο και Κυριακή) και συγκεκριμένες αργίες που καταχωρούνται χωριστά. Ο τύπος =NETWORKDAYS(C3;…


