View the table / Δείτε τον πίνακα [table id=2 /] View large image : https://lnkd.in/dHyranSb #softexperia #mindstormGR Views: 22 Prev Post Forecasting month sales – Months 8 and 9 August 1, 2022 Next Post Creation of 2 dashboards (pivot table and graph) in excel August 9, 2022 Related Posts - Σχετικά Άρθρα Scope Management in Business Transformation November 6, 2026 Practical Example: From Excel Data to Better Business Decisions November 6, 2026 From Excel Data to Better Business Decisions: A Practical Guide to Building Your First KPI Dashboard November 6, 2026 Comments are closed.
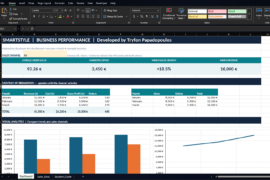
From Excel Data to Better Business Decisions: A Practical Guide to Building Your First KPI Dashboard November 6, 2026



Comments are closed.