

Practical Example: From Excel Data to Better Business Decisions
Case Study: A Small Retail Business Using an Excel KPI Dashboard
Learning objective: You will understand how a business can transform raw Excel data into useful information, identify performance trends, and make better business decisions using Key Performance Indicators (KPIs).
Download the excel file SmartStyle_KPI_Dashboard_xlsx
1. The Business Scenario
Imagine a small retail company called SmartStyle, which sells clothing through two sales channels: a physical store and an online shop.
The business owner wants to answer five important questions:
-
Are our total sales increasing or decreasing?
-
Which sales channel performs better?
-
How profitable are our sales?
-
How much does the average customer order generate?
-
Should we invest more in our physical store or online shop?
Instead of looking at hundreds of individual transactions, the owner decides to build an Excel KPI dashboard.
2. Step 1 — Collect the Data
The business has collected the following information for the first three months of the year.
| Month | Channel | Sales (€) | Cost of Goods (€) | Orders | Marketing (€) |
|---|---|---|---|---|---|
| January | Store | 8,000 | 5,200 | 80 | 400 |
| January | Online | 4,000 | 2,600 | 50 | 600 |
| February | Store | 8,500 | 5,400 | 85 | 400 |
| February | Online | 5,000 | 3,100 | 60 | 700 |
| March | Store | 9,000 | 5,700 | 90 | 450 |
| March | Online | 7,000 | 4,200 | 80 | 900 |
All figures are fictional and intended for classroom use. Each order is counted once; sales are measured excluding VAT.
At first glance, we can see several numbers. However, it is difficult to determine the company’s overall performance immediately.
This is where business analytics begins: we convert the raw numbers into meaningful KPIs.
3. Step 2 — Calculate the KPIs
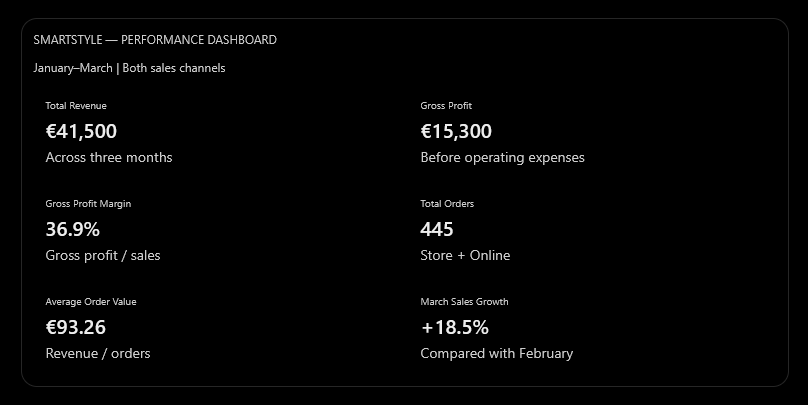
SMARTSTYLE — PERFORMANCE DASHBOARD
January–March | Both sales channels
Total Revenue
€41,500
Across three months
Gross Profit
€15,300
Before operating expenses
Gross Profit Margin
36.9%
Gross profit / sales
Total Orders
445
Store + Online
Average Order Value
€93.26
Revenue / orders
March Sales Growth
+18.5%
Compared with February
Understanding the calculations
| KPI | Formula | Result |
|---|---|---|
| Revenue | Sum of Sales | €41,500 |
| Gross Profit | Sales − Cost of Goods | €15,300 |
| Gross Profit Margin | Gross Profit / Sales × 100 | 36.9% |
| Average Order Value | Revenue / Orders | €93.26 |
| Sales Growth | (March − February) / February × 100 | 18.5% |
For example, the gross profit margin of 36.9% means that for every €100 of sales, approximately €36.90 remains after paying for the products sold. This is not net profit, because marketing, salaries, rent, and other operating expenses may still need to be deducted.
4. Step 3 — Visualize Performance
Chart A: Monthly sales performance
Store versus online sales, January–March
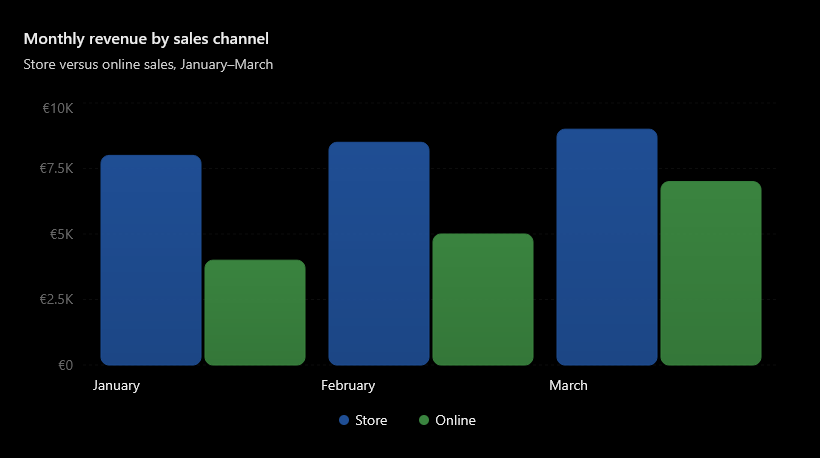
What do students observe? Total monthly sales increase from €12,000 in January to €16,000 in March. Online sales grow faster than physical-store sales.
Chart B: Revenue by channel

The physical store generates approximately 61.4% of revenue, whereas the online shop generates 38.6%.
However, a bigger revenue share does not automatically mean a better growth opportunity.
5. Step 4 — From Information to Business Decisions
This is the most important part of the lesson. A KPI dashboard should not simply display attractive charts. It should help managers make decisions.
| Dashboard finding | Possible business decision |
|---|---|
| Online sales increased from €4,000 to €7,000 | Investigate increasing online inventory and digital promotion |
| Store sales increased from €8,000 to €9,000 | Maintain store operations and examine opportunities for improvement |
| Gross margin is 36.9% | Review product costs and pricing to protect margins |
| Marketing expenditure totals €3,450 | Evaluate campaign returns before increasing spending |
| March revenue grew 18.5% over February | Investigate whether the trend can continue |
Important teaching point: The dashboard shows that online revenue is growing, but it does not prove that additional advertising caused this growth. Management needs more evidence before increasing its marketing budget.
6. Step 5 — Make a Decision
Exercise: You are the business manager.
The company has an additional €2,000 to invest next month. Based on the dashboard, where would you allocate it?
– Evaluate your decision
7. Step 6 — Build It in Excel
You can recreate this dashboard using Excel 2019.
-
Enter the six rows of data in a worksheet called
Sales_Data. -
Select the entire data range and press Ctrl + T to convert it into an Excel Table.
-
Add a column called
Gross Profitand calculate Sales minus Cost of Goods. -
Create a PivotTable, using Month as Rows, Channel as Columns, and Sum of Sales as Values.
-
Insert a PivotChart to compare monthly sales across channels.
-
Create a second PivotTable showing revenue by channel.
-
Add KPI summary cells and charts to a new worksheet called
Dashboard. -
Insert a Slicer for Channel and connect it to compatible PivotTables.
For simple KPI calculations, you can use the following formulas, assuming that Sales are in column C, Cost of Goods in D, Orders in E, and the data occupy rows 2–7:

Excel formulas
Revenue
=SUM(C2:C7)
Gross Profit
=SUM(C2:C7)-SUM(D2:D7)
Gross Margin
=(SUM(C2:C7)-SUM(D2:D7))/SUM(C2:C7)
Average Order Value
=SUM(C2:C7)/SUM(E2:E7)
March Growth
=(SUM(C6:C7)-SUM(C4:C5))/SUM(C4:C5)
Format the margin and growth results as percentages.
8. The Most Important Lesson
DATA
KPIs
INSIGHTS
DECISIONS

Raw numbers become useful when they lead to an informed management decision.
The key message for students is that Excel does not make business decisions for us. Excel helps us organize facts, measure performance, recognize patterns, and evaluate options. The manager must interpret those findings and decide what action to take.
A good final classroom question is:
“If the company has higher sales every month, does this necessarily mean that the business is becoming more profitable? What additional information would you need to answer?”
This encourages students to distinguish between revenue growth, profitability, and business performance, which is fundamental to understanding business analytics.
What’s included
| Worksheet | Contents |
|---|---|
| Dashboard | 8 calculated KPI indicators, 2 charts, monthly performance summaries and an interactive sales-channel selector |
| Sales_Data | All six original sales records, formulas for gross profit and profit margin |
| Student_Guide | Six practical exercises, explanations of KPIs and management decision questions |
How to use it
Open the Dashboard worksheet and change the yellow Sales Channel selector between All, Store, and Online. The KPI values and charts will update automatically.
You can also change the sales figures in Sales_Data to examine how business performance changes.
Suggestion: Try to explain why the online shop’s sales are increasing faster than the physical store’s, and whether this justifies additional marketing investment.
The workbook uses fictional business data and is designed for practical classroom instruction in Excel 2019.



Comments are closed.