
 in excel")
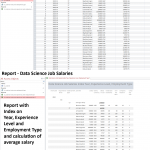
Dataset : Data Science Job Salaries and Sales
Number of Sheets : 3
1) data (dataset) – View large image : https://lnkd.in/dzxPbsDw

2) dashboard (pivot table and graph) – View large image : https://lnkd.in/dM8ZPPUM

3) dashboard 2 (pivot table and graph) – View large image : https://lnkd.in/dkt7V4uG

Download excel file : https://lnkd.in/dfSC9JKT
#dashboard #excel #graphs #softexperia / Linkedin : Softexperia / www.softexperia.com
Views: 2


Comments are closed.