

Turning Excel Into an Automated Financial Modeling Engine with Python
This project automates a dynamic financial dashboard by combining Python with Excel to build and analyze financial statements in real time.
The script starts by reading the Inputs tab, which acts as the model’s driver. From those inputs, it programmatically generates the Balance Sheet, Income Statement, and Cash Flow tabs, performs all core calculations, and then updates the Dashboard tab automatically with key metrics, ratios, and performance analysis.
Watch the video:
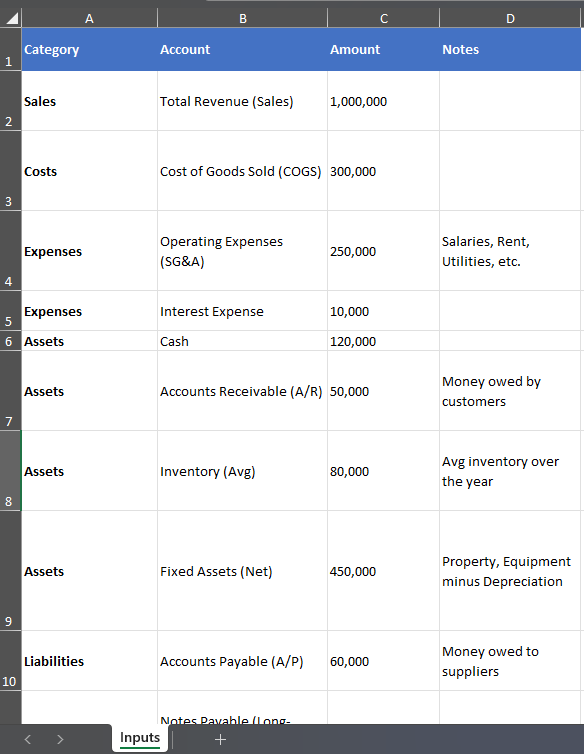
Inputs Tab
| Category | Account | Amount | Notes |
| Sales | Total Revenue (Sales) | 1,000,000 | |
| Costs | Cost of Goods Sold (COGS) | 300,000 | |
| Expenses | Operating Expenses (SG&A) | 250,000 | Salaries, Rent, Utilities, etc. |
| Expenses | Interest Expense | 10,000 | |
| Assets | Cash | 120,000 | |
| Assets | Accounts Receivable (A/R) | 50,000 | Money owed by customers |
| Assets | Inventory (Avg) | 80,000 | Avg inventory over the year |
| Assets | Fixed Assets (Net) | 450,000 | Property, Equipment minus Depreciation |
| Liabilities | Accounts Payable (A/P) | 60,000 | Money owed to suppliers |
| Liabilities | Notes Payable (Long-Term) | 150,000 | Long-term debt |
| Equity | Beginning Retained Earnings | 20,000 | Profit carried over from prior year |
| Equity | Common Stock | 100,000 | Initial capital |
| Other | Depreciation Expense | 20,000 | |
| Other | Dividends Paid | 10,000 | Paid to owners |
| Other | Tax Rate | 25% |
The dashboard includes KPIs such as:
- Revenue, Gross Profit, and Net Income
- Liquidity and solvency ratios
- Profitability metrics such as ROA and ROE
- Efficiency measures like Inventory Turnover and DSO
- Break-even analysis and operating cash flow
In addition to calculations, the script produces a dynamic five-point performance analysis, turning financial outputs into concise business insights on profitability, liquidity, leverage, cash generation, and risk.
Features include:
- Automated financial statement generation from input assumptions
- Dynamic Excel dashboard updates
- Ratio and break-even analysis
- CLI financial summary output
- Euro reporting format
- Scenario-driven commentary that changes as inputs change
This project demonstrates how Python can transform Excel from a manual spreadsheet into an automated financial modeling and decision-support tool.
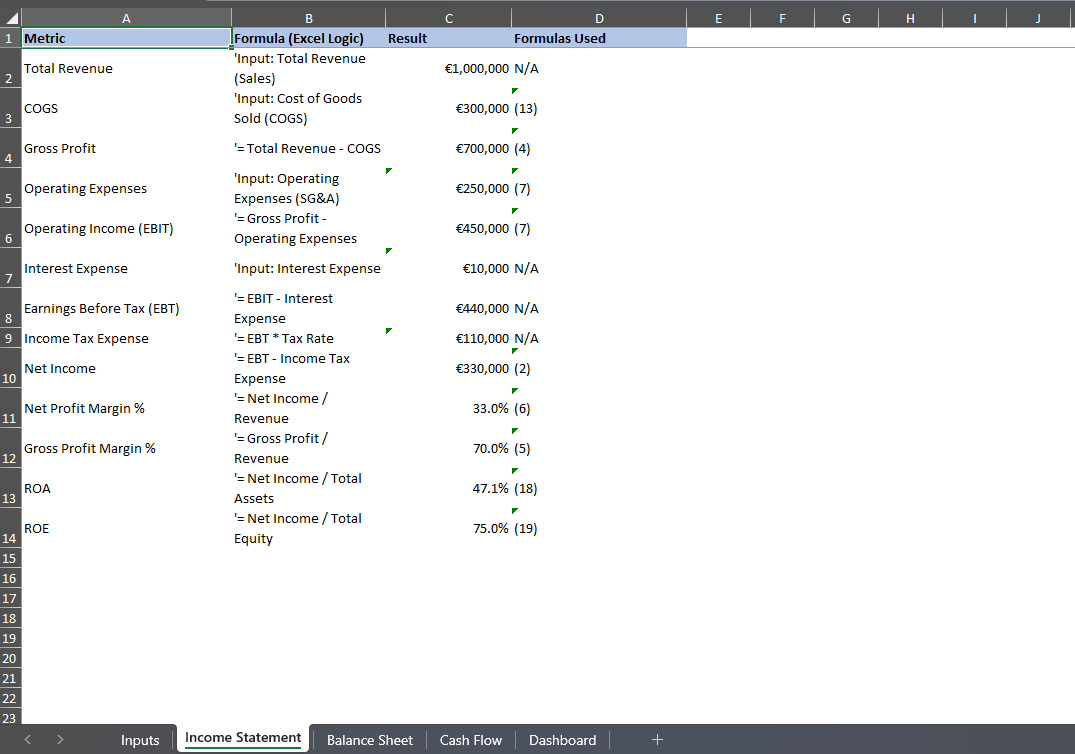
Income Statement Tab
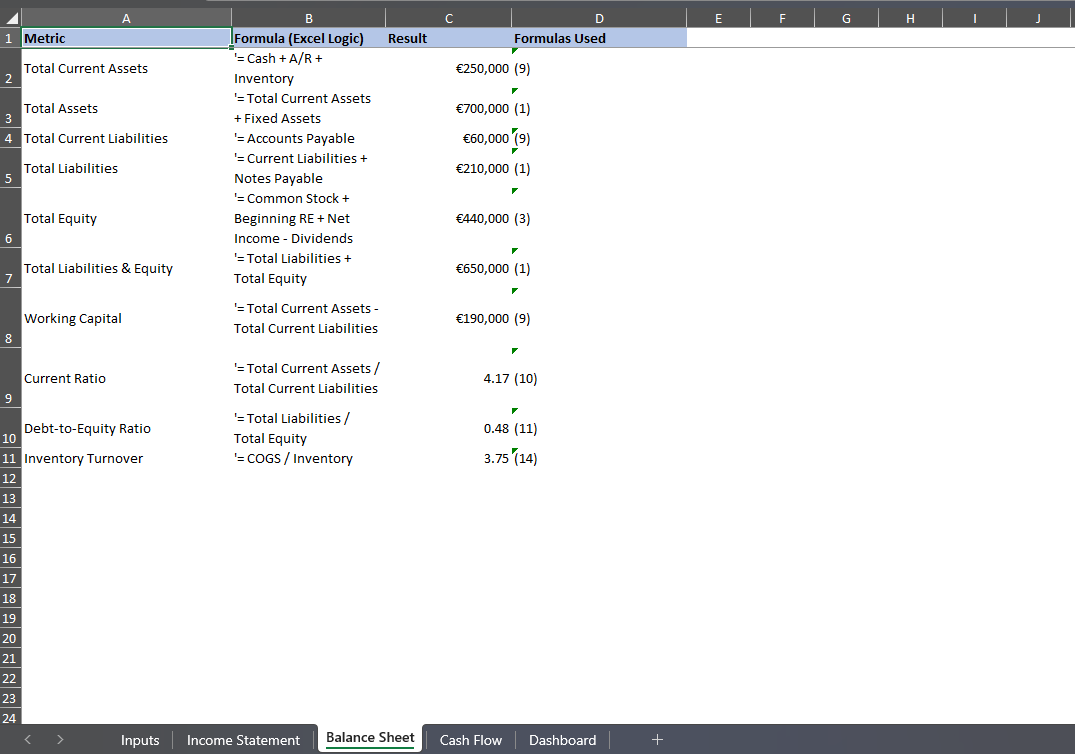
Balance Sheet Tab
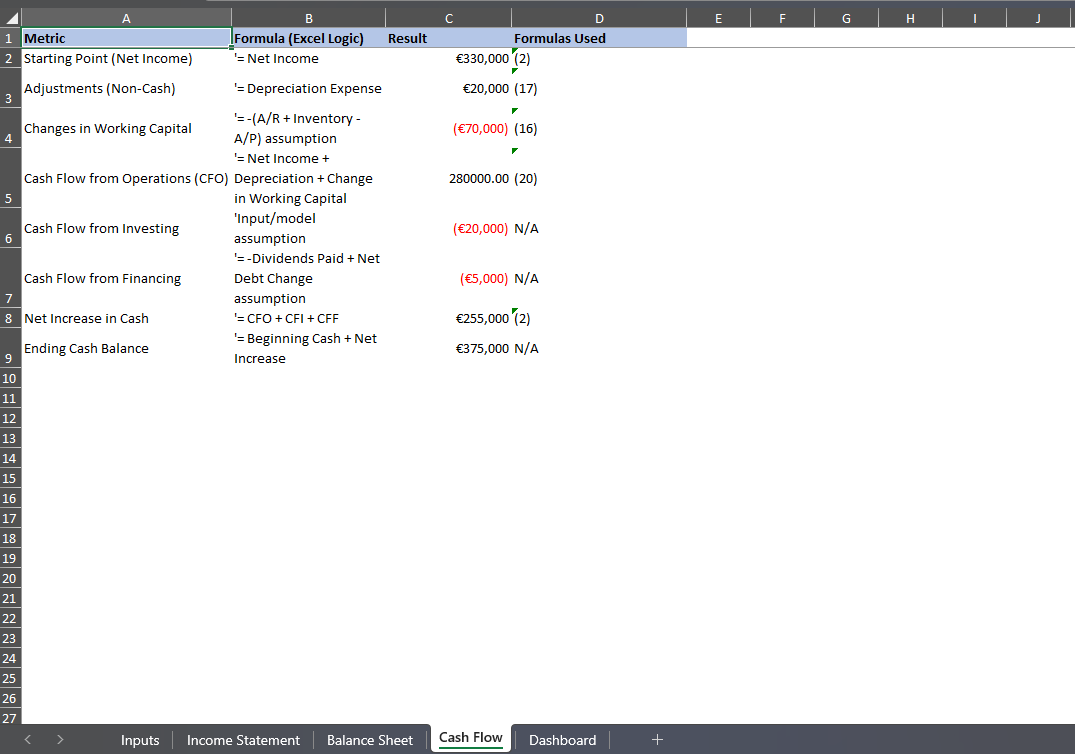
Cash Flow Tab
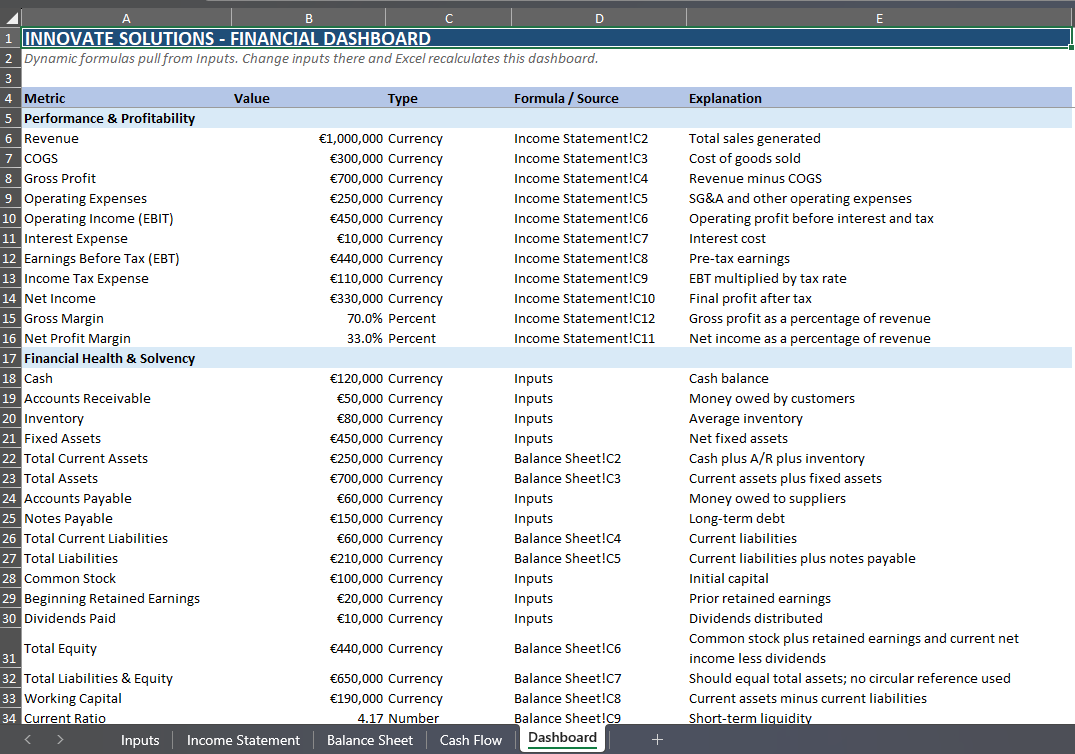
Dashboard Tab
| INNOVATE SOLUTIONS – FINANCIAL DASHBOARD | ||||
| Dynamic formulas pull from Inputs. Change inputs there and Excel recalculates this dashboard. | ||||
| Metric | Value | Type | Formula / Source | Explanation |
| Performance & Profitability | ||||
| Revenue | €1,000,000 | Currency | Income Statement!C2 | Total sales generated |
| COGS | €300,000 | Currency | Income Statement!C3 | Cost of goods sold |
| Gross Profit | €700,000 | Currency | Income Statement!C4 | Revenue minus COGS |
| Operating Expenses | €250,000 | Currency | Income Statement!C5 | SG&A and other operating expenses |
| Operating Income (EBIT) | €450,000 | Currency | Income Statement!C6 | Operating profit before interest and tax |
| Interest Expense | €10,000 | Currency | Income Statement!C7 | Interest cost |
| Earnings Before Tax (EBT) | €440,000 | Currency | Income Statement!C8 | Pre-tax earnings |
| Income Tax Expense | €110,000 | Currency | Income Statement!C9 | EBT multiplied by tax rate |
| Net Income | €330,000 | Currency | Income Statement!C10 | Final profit after tax |
| Gross Margin | 70.0% | Percent | Income Statement!C12 | Gross profit as a percentage of revenue |
| Net Profit Margin | 33.0% | Percent | Income Statement!C11 | Net income as a percentage of revenue |
| Financial Health & Solvency | ||||
| Cash | €120,000 | Currency | Inputs | Cash balance |
| Accounts Receivable | €50,000 | Currency | Inputs | Money owed by customers |
| Inventory | €80,000 | Currency | Inputs | Average inventory |
| Fixed Assets | €450,000 | Currency | Inputs | Net fixed assets |
| Total Current Assets | €250,000 | Currency | Balance Sheet!C2 | Cash plus A/R plus inventory |
| Total Assets | €700,000 | Currency | Balance Sheet!C3 | Current assets plus fixed assets |
| Accounts Payable | €60,000 | Currency | Inputs | Money owed to suppliers |
| Notes Payable | €150,000 | Currency | Inputs | Long-term debt |
| Total Current Liabilities | €60,000 | Currency | Balance Sheet!C4 | Current liabilities |
| Total Liabilities | €210,000 | Currency | Balance Sheet!C5 | Current liabilities plus notes payable |
| Common Stock | €100,000 | Currency | Inputs | Initial capital |
| Beginning Retained Earnings | €20,000 | Currency | Inputs | Prior retained earnings |
| Dividends Paid | €10,000 | Currency | Inputs | Dividends distributed |
| Total Equity | €440,000 | Currency | Balance Sheet!C6 | Common stock plus retained earnings and current net income less dividends |
| Total Liabilities & Equity | €650,000 | Currency | Balance Sheet!C7 | Should equal total assets; no circular reference used |
| Working Capital | €190,000 | Currency | Balance Sheet!C8 | Current assets minus current liabilities |
| Current Ratio | 4.17 | Number | Balance Sheet!C9 | Short-term liquidity |
| Debt-to-Equity Ratio | 0.48 | Number | Balance Sheet!C10 | Leverage ratio |
| Efficiency & Cash Flow | ||||
| Inventory Turnover | 3.75 | Number | Balance Sheet!C11 | COGS divided by average inventory |
| Asset Turnover | 1.43 | Number | Revenue / Total Assets | Revenue generated per dollar of assets |
| Accounts Receivable Turnover | 20.00 | Number | Revenue / A/R | Revenue divided by accounts receivable |
| DSO | 18.3 | Days | A/R / Revenue * 365 | Average days to collect receivables |
| Depreciation | €20,000 | Currency | Inputs | Non-cash depreciation expense |
| Changes in Working Capital | (€70,000) | Currency | Cash Flow!C4 | Working capital impact on cash flow |
| Cash Flow from Operations | €280,000 | Currency | Cash Flow!C5 | Operating cash generated |
| Return & Planning Metrics | ||||
| ROA | 47.1% | Percent | Income Statement!C13 | Net income divided by total assets |
| ROE | 75.0% | Percent | Income Statement!C14 | Net income divided by total equity |
| Break-Even Point | €357,143 | Currency | Operating Expenses / Gross Margin | Revenue needed to cover operating expenses |
| Short Performance Analysis | ||||
| 1. | Profitability is strong, with a gross margin of 70.0%, showing healthy spread between revenue and COGS. | |||
| 2. | Net profit margin is solid at 33.0%, meaning the company retains a good share of sales as profit. | |||
| 3. | Liquidity is comfortable: the current ratio is 4.17, so short-term obligations appear well covered. | |||
| 4. | Leverage is moderate, with a debt-to-equity ratio of 0.48, suggesting the balance sheet is not overly debt-heavy. | |||
| 5. | Cash generation is supportive: CFO is €280,000, compared with net income of €330,000. DSO is 18.2 days, ROA is 47.1%, ROE is 75.0%, and break-even revenue is €357,143 versus revenue of €1,000,000. | |||


Comments are closed.