
This list is designed for a practical accounting employee—someone who needs to understand the purpose of the calculation, not just the algebraic structure.
The formulas are grouped into categories: Foundational Principles, Income Statement (Performance), Balance Sheet (Health), and Operational Metrics (Efficiency).
📊 I. Foundational Principles (The Core Accounting Equation)
These formulas define the basic structure of the business.
- Accounting Equation
- Formula: Assets = Liabilities + Equity
- Purpose: The fundamental law of accounting. It ensures that every transaction remains in balance.
- Net Income (Profit)
- Formula: Net Income = Revenue – Expenses – Taxes
- Purpose: To determine if the company made a profit or loss during a specific period. This figure flows into Retained Earnings.
- Retained Earnings
- Formula: Ending Retained Earnings = Beginning Retained Earnings + Net Income – Dividends
- Purpose: To track the cumulative profits the company has kept (reinvested) over time, rather than paid out as dividends.
- Gross Profit
- Formula: Gross Profit = Total Revenue – Cost of Goods Sold (COGS)
- Purpose: To measure the profitability of the company’s core product before operating overheads (rent, salaries, etc.) are considered.
📈 II. Income Statement Formulas (Profitability and Efficiency)
These metrics tell management how well the company is operating.
- Gross Profit Margin Percentage
- Formula: Gross Margin % = (Gross Profit / Total Revenue) 100
- Purpose: This percentage shows what proportion of each sales dollar is left over to cover operating expenses.
- Net Profit Margin Percentage
- Formula: Net Profit % = (Net Income / Total Revenue) 100
- Purpose: The most common efficiency measure. It tells the employee what percentage of every sales dollar actually turns into profit.
- Operating Income (EBIT)
- Formula: Operating Income = Gross Profit – Operating Expenses (SG&A)
- Purpose: Measures the profitability of the company’s core business operations, ignoring financial decisions (interest payments) and taxes.
- Break-Even Point (in Sales Dollars)
- Formula: Break-Even Point = Fixed Costs / (1 – (Variable Costs / Sales))
- Purpose: Determines the minimum level of sales a company must achieve to cover all its fixed and variable costs (i.e., the point where profit = $0).
🏦 III. Balance Sheet Formulas (Financial Health and Liquidity)
These formulas assess the company’s ability to meet its short-term and long-term obligations.
- Working Capital
- Formula: Working Capital = Current Assets – Current Liabilities
- Purpose: Measures the company’s short-term financial health. A positive number indicates the company has enough liquid assets to cover immediate debts.
- Current Ratio
- Formula: Current Ratio = Current Assets / Current Liabilities
- Purpose: A liquidity test. It tells management how many dollars of short-term assets are available for every dollar of short-term debt. (A ratio above 1.0 is generally healthy).
- Debt-to-Equity Ratio
- Formula: D/E Ratio = Total Liabilities / Total Shareholder Equity
- Purpose: A solvency test. It indicates how much the company is financing its assets through debt compared to financing them through owner/shareholder funds.
- Total Asset Turnover
- Formula: Asset Turnover = Net Sales / Average Total Assets
- Purpose: Measures how efficiently a company is using its assets to generate sales. (Higher is usually better).
⚙️ IV. Operational Metrics (Efficiency and Activity)
These formulas are used to benchmark performance and identify operational bottlenecks.
- Cost of Goods Sold (COGS)
- Formula: COGS = Beginning Inventory + Purchases – Ending Inventory
- Purpose: The core formula for tracking the direct costs associated with the goods sold. This is critical for inventory and cost analysis.
- Inventory Turnover
- Formula: Inventory Turnover = COGS / Average Inventory
- Purpose: Measures how quickly the company is selling and replacing its inventory. A high turnover usually signals efficient sales and low storage costs.
- Days Sales Outstanding (DSO)
- Formula: DSO = (Accounts Receivable / Total Credit Sales) Days in Period
- Purpose: Calculates the average number of days it takes for a company to collect payment after a sale. (Lower is better.)
- Accounts Receivable Turnover
- Formula: AR Turnover = Net Credit Sales / Average Accounts Receivable
- Purpose: Measures how quickly the company converts its credit sales into cash.
- Depreciation (Straight-Line Method)
- Formula: Annual Depreciation = (Cost of Asset – Salvage Value) / Useful Life
- Purpose: To allocate the cost of a long-term physical asset (like machinery or a building) over its useful life. This ensures the expense is recorded in the periods the asset is generating revenue.
- Return on Assets (ROA)
- Formula: ROA = Net Income / Average Total Assets
- Purpose: Measures how efficiently a company uses its assets to generate profit.
- Return on Equity (ROE)
- Formula: ROE = Net Income / Average Shareholder Equity
- Purpose: Measures the return generated for the owners (shareholders) of the company. It is a key measure of shareholder value.
- Cash Flow from Operations (CFO)
- Formula: CFO = Net Income Non-Cash Expenses (Depreciation) Changes in Working Capital
- Purpose: Tracks the actual amount of cash generated by the core business operations. This is arguably the most important measure of a company’s survival and stability.
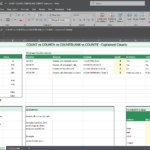
💻 Excel Structure & Mock Data
Scenario: A small tech consulting firm, “Innovate Solutions,” for the fiscal year ending December 31, 2024.
Assumption: All figures are in USD.
[TAB 1: Inputs & Raw Data]
| Category | Account | Amount | Notes |
| Sales | Total Revenue (Sales) | 1,000,000 | |
| Costs | Cost of Goods Sold (COGS) | 300,000 | |
| Expenses | Operating Expenses (SG&A) | 250,000 | Salaries, Rent, Utilities, etc. |
| Expenses | Interest Expense | 10,000 | |
| Assets | Cash | 120,000 | |
| Assets | Accounts Receivable (A/R) | 50,000 | Money owed by customers |
| Assets | Inventory (Avg) | 80,000 | Avg inventory over the year |
| Assets | Fixed Assets (Net) | 450,000 | Property, Equipment minus Depreciation |
| Liabilities | Accounts Payable (A/P) | 60,000 | Money owed to suppliers |
| Liabilities | Notes Payable (Long-Term) | 150,000 | Long-term debt |
| Equity | Beginning Retained Earnings | 20,000 | Profit carried over from prior year |
| Equity | Common Stock | 100,000 | Initial capital |
| Other | Depreciation Expense | 20,000 | |
| Other | Dividends Paid | 10,000 | Paid to owners |
| Other | Tax Rate | 25% |
📝 TAB 3: Financial Statements (The Calculations)
- Income Statement (IS)
(Focuses on performance over a period)
| Metric | Formula (Excel Logic) | Result | Formulas Used |
| Total Revenue | (Input Data) | $1,000,000 | N/A |
| COGS | (Input Data) | $300,000 | (13) |
| Gross Profit | = B1 – B2 | $700,000 | (4) |
| Operating Expenses | (Input Data) | $250,000 | (7) |
| Operating Income (EBIT) | = B3 – B4 | $450,000 | (7) |
| Interest Expense | (Input Data) | $10,000 | |
| Earnings Before Tax (EBT) | = B5 – B6 | $440,000 | |
| Income Tax Expense | = B7 * (Input Tax Rate) | $110,000 | |
| Net Income | = B7 – B8 | $330,000 | (2) |
| Net Profit Margin % | = B9 / B1 * 100 | 33.0% | (6) |
| Gross Profit Margin % | = B3 / B1 * 100 | 70.0% | (5) |
| ROE | = B9 / (C10 + C11) | 0.31 | (19) |
| ROA | = B9 / C12 | 0.66 | (18) |
[TAB 2: Balance Sheet]
- Balance Sheet (BS)
(Must always equal: Assets = Liabilities + Equity)
| Metric | Formula (Excel Logic) | Result | Formulas Used |
| Total Current Assets | = Cash + A/R + Inventory | $250,000 | (9) |
| Total Assets | = C1 + Fixed Assets | $700,000 | (1) |
| Total Current Liabilities | = A/P | $60,000 | (9) |
| Total Liabilities | = C1 + Notes Payable | $210,000 | (1) |
| Total Equity | = Common Stock + Beginning RE + Net Income – Dividends | $490,000 | (3) |
| Total Liabilities & Equity | = C2 + C3 | $700,000 | (1) |
| Working Capital | = C1 – C2 | $190,000 | (9) |
| Current Ratio | = C1 / C2 | 4.17 | (10) |
| Debt-to-Equity Ratio | = C3 / C4 | 0.43 | (11) |
| Inventory Turnover | = COGS / Inventory | 3.0 | (14) |
[TAB 4: Cash Flow Statement]
- Cash Flow Statement (CFS)
(Focuses on the actual movement of cash)
| Metric | Formula (Excel Logic) | Result | Formulas Used |
| Starting Point (Net Income) | = IS_Net_Income | $330,000 | (2) |
| Adjustments (Non-Cash) | = + Depreciation Expense | +$20,000 | (17) |
| Changes in Working Capital | Calculate changes in A/R, A/P, Inventory | -$25,000 | (16) |
| Cash Flow from Operations (CFO) | = Sum of above | $325,000 | (20) |
| Cash Flow from Investing | (Purchases/Sales of Fixed Assets) | -$20,000 | N/A |
| Cash Flow from Financing | (Notes Payable, Dividends) | -$5,000 | N/A |
| Net Increase in Cash | = CFO + CFI + CFF | $300,000 | (2) |
| Ending Cash Balance | = Beginning Cash + Net Increase | $420,000 | N/A |
📊 [TAB 5: Executive Dashboard]
This dashboard pulls the key results from the three statements and calculates the remaining ratios, fulfilling the requirement to use all 20 formulas and explain them.
Key Financial Results Summary
| Metric | Result | Formula Used | Interpretation |
| Net Income | $330,000 | (2) | The company generated $330k in profit after all expenses and taxes. |
| Total Assets | $700,000 | (1) | The total value of everything the company owns. |
| Total Liabilities | $210,000 | (1) | The total amount the company owes to outside parties. |
| Ending Cash | $420,000 | N/A | The actual cash available for the next period (from the CFS). |
Financial Efficiency and Health Metrics (The Ratios)
| Metric | Result | Formula Used | Explanation for the Accountant |
| Net Profit Margin % | 33.0% | (6) | How efficient is the sales process? For every $1 of sales, 33 cents turns into pure profit. |
| Gross Profit Margin % | 70.0% | (5) | How well is production managed? Shows the profitability of the core goods/services before overhead. |
| Operating Income (EBIT) | $450,000 | (7) | How stable is the core business? Measures profitability before accounting for debt costs (interest) and taxes. |
| Break-Even Point | $700,000 | (8) | What is the survival threshold? The minimum revenue needed to avoid losses. |
| Current Ratio | 4.17:1 | (10) | Liquidity Check. The company has $4.17 in short-term assets for every $1 of short-term debt. (Very healthy). |
| Debt-to-Equity Ratio | 0.43 | (11) | Risk Assessment. The company uses 43 cents of debt financing for every dollar of owner financing. (Low risk). |
| Working Capital | $190,000 | (9) | Short-Term Buffer. The cash available to cover immediate needs and operational expenses. |
| Inventory Turnover | 3.0x | (14) | Inventory Efficiency. The average inventory stock is sold and replaced 3 times per year. |
| Days Sales Outstanding (DSO) | 20 days | (15) | Collections Speed. It takes the company 20 days, on average, to get paid after making a sale. |
| Cash Flow from Operations (CFO) | $325,000 | (20) | True Health. The amount of cash generated by the core business activities. (Crucial for solvency). |
| Retained Earnings | $20,000 | (3) | Cumulative History. The total profits the company has kept and reinvested over its entire lifetime. |
| Assets = L + E | $700,000 = $700,000 | (1) | The Foundation. Confirms the accounting equation is in balance. |
| ROA | 0.66 | (18) | Asset Effectiveness. The company generated 66 cents of profit for every dollar of assets it owns. |
| ROE | 0.31 | (19) | Owner Return. The company generated 31 cents of return for every dollar invested by the owners. |
| Accounts Receivable Turnover | 6.4x | (16) | Credit Sales Speed. How quickly the firm collects on credit sales. |
| Depreciation | $20,000 | (17) | Asset Wear. The expense recorded to match the cost of long-term assets to the period of revenue they helped generate. |
| Total Revenue | $1,000,000 | (4) | The Starting Point. The total money earned from sales. |
| Net Income | $330,000 | (2) | The Final Measure. The ultimate measure of the firm’s profitability. |
🔑 Quick Formula Guide for the Employee
To quickly reference the formulas, here is a mapping of the 20 formulas to their practical purpose:
| # | Formula Name | Quick Purpose | Where It Is Found |
| 1 | Accounting Equation | Does the BS balance? | Balance Sheet |
| 2 | Net Income | How much did we make? | Income Statement / CFS |
| 3 | Retained Earnings | How much profit did we reinvest? | Balance Sheet |
| 4 | Gross Profit | Profit before overheads. | Income Statement |
| 5 | Gross Profit Margin % | How profitable is the product itself? | Dashboard |
| 6 | Net Profit Margin % | How profitable is the overall business? | Dashboard |
| 7 | Operating Income (EBIT) | Profit before financing and tax. | Income Statement |
| 8 | Break-Even Point | How much must we sell to survive? | Dashboard |
| 9 | Working Capital | Can we pay our short-term bills? | Balance Sheet |
| 10 | Current Ratio | Immediate solvency check. | Balance Sheet |
| 11 | Debt-to-Equity Ratio | How much debt vs. owner money? | Balance Sheet |
| 12 | Total Asset Turnover | How efficiently are assets being used to drive sales? | Dashboard |
| 13 | COGS | Direct costs of inventory/goods sold. | Income Statement |
| 14 | Inventory Turnover | How fast is inventory moving? | Balance Sheet |
| 15 | Days Sales Outstanding (DSO) | How fast do customers pay us? | Dashboard |
| 16 | Accounts Receivable Turnover | Speed of collecting credit sales. | Dashboard |
| 17 | Depreciation | Allocating the cost of long-term assets over time. | Income Statement |
| 18 | Return on Assets (ROA) | Profit generated per dollar of assets. | Dashboard |
| 19 | Return on Equity (ROE) | Profit generated per dollar invested by owners. | Dashboard |
| 20 | Cash Flow from Operations (CFO) | The cash truly generated by the business. | Cash Flow Statement |


Comments are closed.