

How to Calculate CTR, CVR, and ROI in Your Marketing Funnel (With Real Excel Example)
Understanding the performance of your digital marketing campaigns isn’t just about impressions or clicks. To truly measure impact, you need to track and evaluate key performance ratios such as:
-
CTR (Click-Through Rate)
-
CVR (Conversion Rate)
-
ROI (Return on Investment)
Let’s break down what each of these metrics means using a practical Excel example.
The Setup
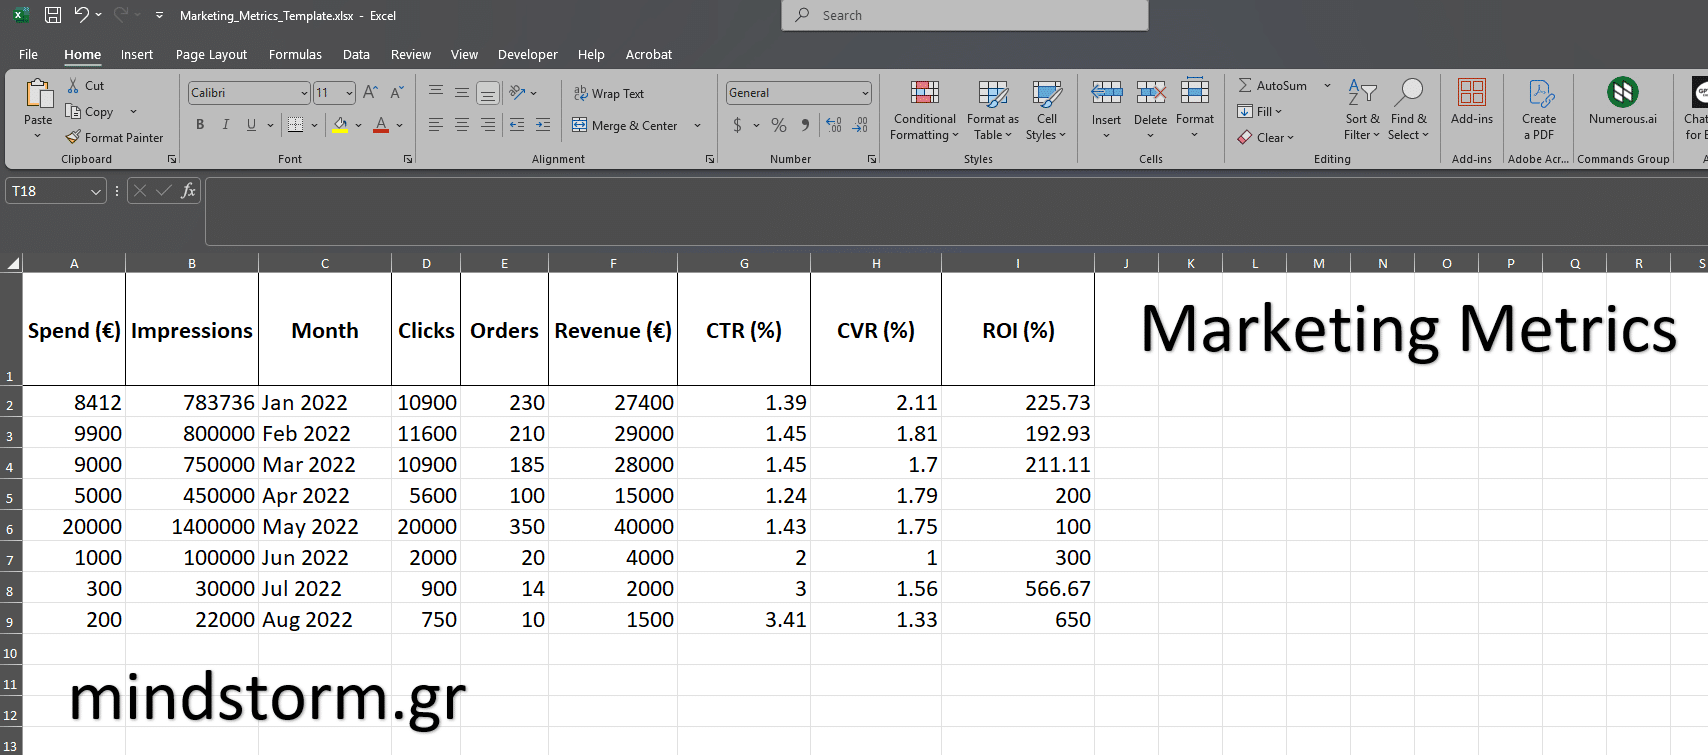
The spreadsheet presents monthly marketing campaign data from January to August 2022, showing how much was spent on advertising, how many times the ad was shown (impressions), how many people clicked, how many orders were placed, and how much revenue was generated.
Metrics Tracked per Month:
| Column | Description |
|---|---|
| Spend (€) | How much was invested in the ad campaign. |
| Impressions | How many times the ad was displayed. |
| Clicks | Number of people who clicked on the ad. |
| Orders | Number of sales/orders placed after clicking. |
| Revenue (€) | Total revenue generated. |
Key Ratios Explained
At the end of the table, we see three calculated columns:
1. ✅ CTR – Click Through Rate
This measures how effective the ad is at getting clicks from viewers.
Formula:CTR = (Clicks / Impressions) × 100
Example:
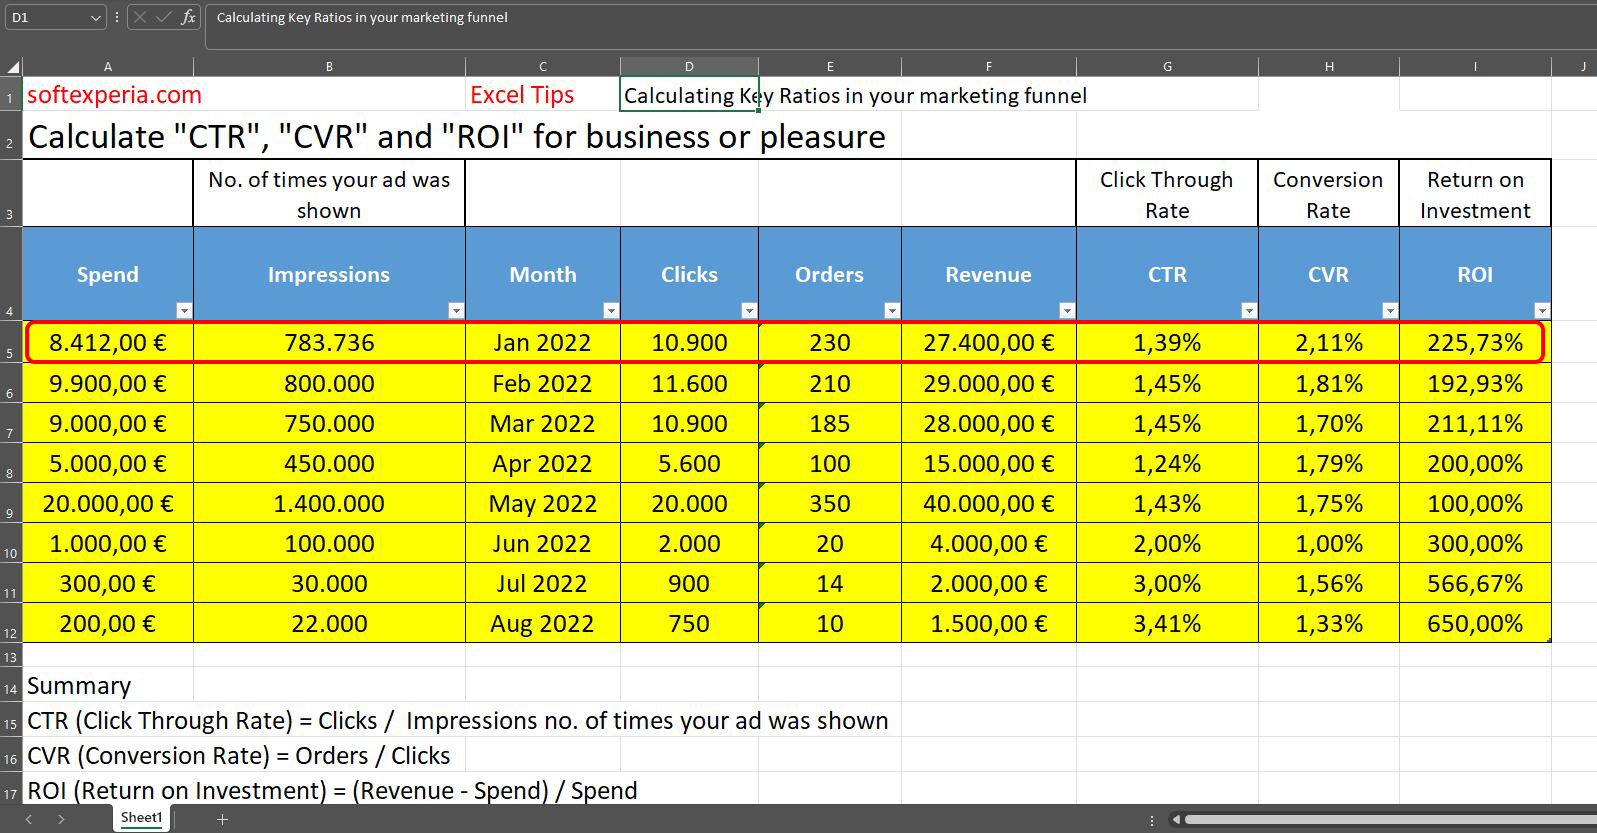
In Jan 2022, the CTR was 1.39% – meaning about 1.39 people clicked for every 100 who saw the ad.
2. CVR – Conversion Rate
This tells you how many of those who clicked went on to make a purchase.
Formula:CVR = (Orders / Clicks) × 100
Example:
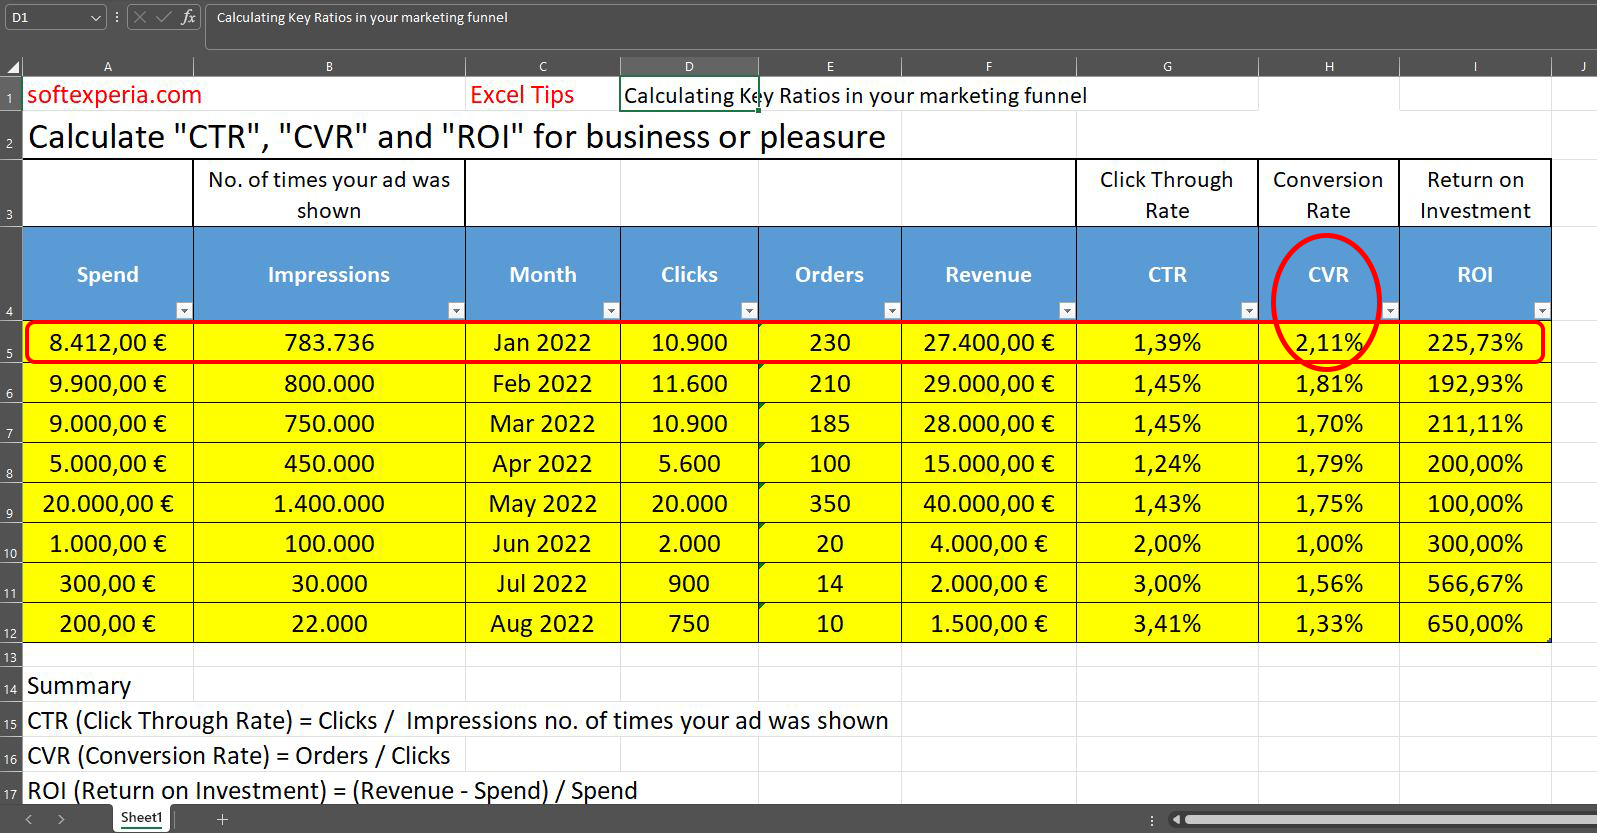
In Jan 2022, the CVR was 2.11% – so out of every 100 clicks, a little over 2 resulted in a sale.
3. ROI – Return on Investment
The most crucial metric — this shows how much profit you made for each euro spent.
Formula:ROI = ((Revenue - Spend) / Spend) × 100
Example:
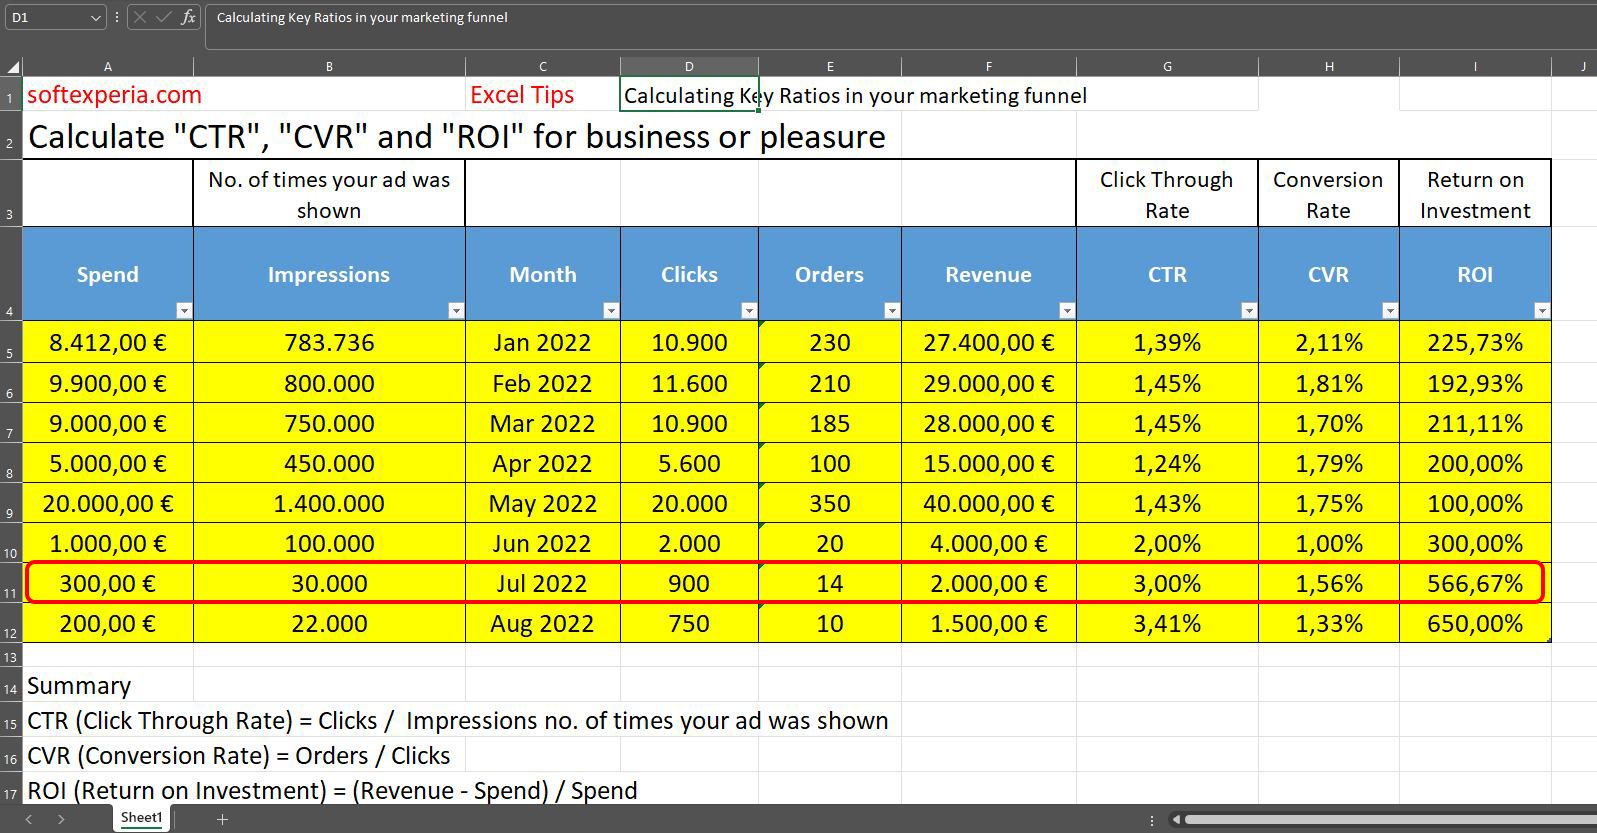
In July 2022, with only €300 spend and €2,000 in revenue, the ROI reached an impressive 566.67%.
Insights from the Table
-
Low spend doesn’t mean low return: The campaigns in July and August spent under €300 but delivered the highest ROI – over 600%!
-
High impressions don’t guarantee results: May 2022 had the highest impressions (1.4 million), but ROI was just 100%.
-
Balanced performance: Months like January–March had consistent CTRs around 1.4% and solid CVRs and ROIs — a sign of stable campaign strategy.
Final Thoughts
This Excel setup is a great example of how structured tracking of marketing metrics can give you actionable insights. Even basic ratios like CTR, CVR, and ROI can tell you:
-
Where your marketing money works best
-
When to scale or pause a campaign
-
What channels deliver real returns
Use this format as a template to optimize your own ad strategy, and don’t forget: data-driven marketing is smart marketing.
Would you like a free Excel template based on this model to use for your campaigns?
Read this article in Greek – Διαβάστε το παραπάνω άρθρο στα Ελληνικά
Πώς να Υπολογίσετε CTR, CVR και ROI στο Marketing Funnel σας


Comments are closed.