
 για την περίοδο 30/4/2015 – 30/4/2022 με γλώσσα προγραμματισμού Python")
Δημιουργία απλής εφαρμογής γραφήματος μετοχής (Google) για την περίοδο 30/4/2015 – 30/4/2022 με γλώσσα προγραμματισμού Python.
Βιβλιοθήκες (libraries) : yfinance, streamlit, pandas
Βήματα
1) Εγκατάσταση των βιβλιοθηκών με τις εντολές στο powershell (command prompt) :
pip install yfinance
pip install streamlit
pip install pandas
2) Δημιουργία αρχείου simple_stock_price_app. py
με Visual Studio Code ή κάποιο άλλο επεξεργαστή κειμένου με τον κώδικα που βλέπετε παρακάτω.
# code starts here ———
# ==========================================================
# REQUIREMENTS CHECK
# ==========================================================
import sys
required_packages = {
“yfinance”: “yfinance”,
“streamlit”: “streamlit”,
“pandas”: “pandas”
}
missing_packages = []
for import_name, pip_name in required_packages.items():
try:
__import__(import_name)
except ImportError:
missing_packages.append(pip_name)
if missing_packages:
print(“\nMissing required packages:”)
for pkg in missing_packages:
print(f” – {pkg}”)
print(“\nInstall them with:\n”)
print(f”pip install {‘ ‘.join(missing_packages)}”)
print(“\nOr with the current Python version:\n”)
print(f”{sys.executable} -m pip install {‘ ‘.join(missing_packages)}”)
input(“\nPress ENTER to close the window…”)
sys.exit()
# ==========================================================
# IMPORTS
# ==========================================================
import yfinance as yf
import streamlit as st
import pandas as pd
# ==========================================================
# STREAMLIT APP
# ==========================================================
st.write(“””
# Simple Stock Price App – Απλή εφαρμογή γραφήματος διακύμανσης μετοχής
Shown are the stock **closing price** and ***volume*** of Google!
Powered by Softexperia.com
“””)
# define the ticker symbol
tickerSymbol = ‘GOOGL’
stock_name = ‘GOOGLE’
# get data on this ticker
tickerData = yf.Ticker(tickerSymbol)
# get the historical prices for this ticker
tickerDf = tickerData.history(
start=’2015-04-30′,
end=’2022-04-30′
)
# Open High Low Close Volume Dividends Stock Splits
st.write(“””
## Closing Price – Τιμή κλεισίματος
“””)
st.line_chart(tickerDf.Close)
st.write(“””
## Volume Price
“””)
st.line_chart(tickerDf.Volume)
# ==========================================================
# DATA TABLE
# ==========================================================
st.write(“””
## Stock Data Table – Πίνακας δεδομένων
“””)
st.dataframe(tickerDf)
# ==========================================================
# BEST & WORST PERFORMANCE PER YEAR
# ==========================================================
st.write(“””
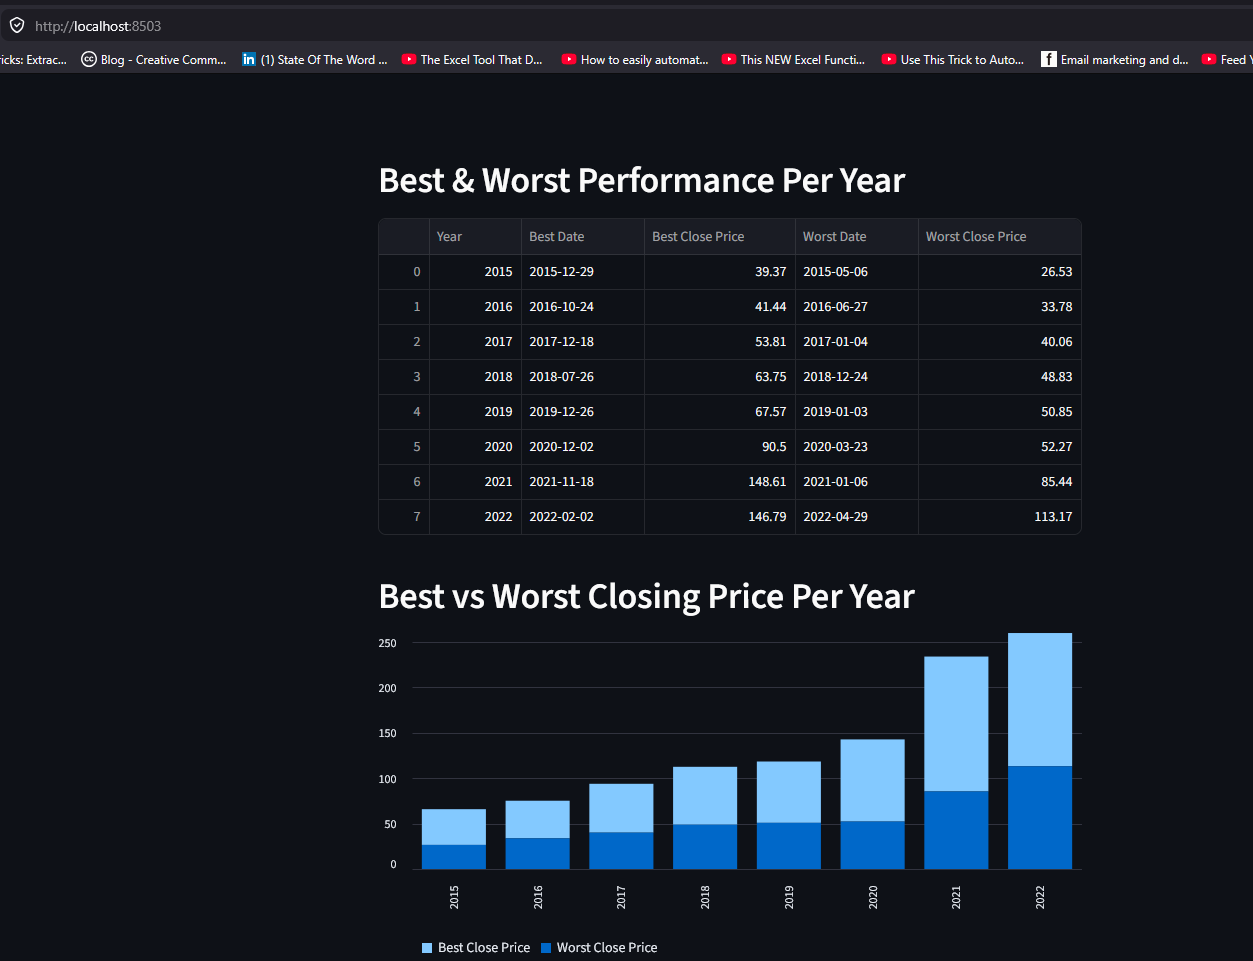
## Best & Worst Performance Per Year
“””)
# Create a copy
performance_df = tickerDf.copy()
# Keep only Close price
performance_df = performance_df[[‘Close’]]
# Create Year column
performance_df[‘Year’] = performance_df.index.year
results = []
# Group by year
for year, group in performance_df.groupby(‘Year’):
# Best day
best_day = group[‘Close’].idxmax()
best_price = group[‘Close’].max()
# Worst day
worst_day = group[‘Close’].idxmin()
worst_price = group[‘Close’].min()
results.append({
‘Year’: year,
‘Best Date’: best_day.date(),
‘Best Close Price’: round(best_price, 2),
‘Worst Date’: worst_day.date(),
‘Worst Close Price’: round(worst_price, 2)
})
# Create results table
results_df = pd.DataFrame(results)
# Show table
st.dataframe(results_df)
# ==========================================================
# BEST VS WORST PRICE CHART
# ==========================================================
st.write(“””
## Best vs Worst Closing Price Per Year
“””)
# Prepare chart data
chart_df = results_df.set_index(‘Year’)[
[‘Best Close Price’, ‘Worst Close Price’]
]
# Show chart
st.bar_chart(chart_df)
# ==========================================================
# CLOSE WINDOW CONFIRMATION
# ==========================================================
print(“\nApplication finished.”)
input(“Press ENTER to close the window…”)
# code ends here ———
3) Λειτουργία (run) εφαρμογής στο terminal του Visual Studio Code με την εντολή :
streamlit run simple_stock_price_app.py
or
py -3.11 -m streamlit run simple_stock_price_app.py
Folder and filename: “C:\PythonPrograms\simple_stock_price\simple_stock_price_app.py”
Views: 1


Comments are closed.