

“Need some sample data to test your data analysis scripts or build a machine learning model? Generating your own data can be tricky, but it doesn’t have to be! In this tutorial, we’ll walk you through creating a realistic sales dataset using Python. We’ll use the popular pandas and numpy libraries to generate data that mimics a real-world sales environment. No prior experience with these libraries is required – we’ll explain everything step-by-step!”
Here’s a a quick breakdown of the code:
- Import Libraries:
pandas: For creating and manipulating the DataFrame.numpy: For generating random numbers.
- Set Random Seed:
np.random.seed(42)This line ensures that the random numbers generated are the same each time you run the code, making the demo reproducible. You can change the seed value if you want different random data. - Define Number of Rows:
num_rows = 100Sets the number of rows in the demo file. - Generate Random Data:
product_ids: Generates random integers between 1000 and 1009 (inclusive) to simulate product IDs.customer_ids: Generates random integers between 1 and 200 (inclusive) to simulate customer IDs.sales_dates: Creates random dates within 2023.pd.to_datetime('2023-01-01')sets the starting date, andpd.to_timedelta(np.random.randint(0, 365, num_rows), unit='D')adds a random number of days (0-364) to each date.sales_amounts: Generates random floating-point numbers between 10 and 200 to simulate sales amounts.payment_methods: Randomly selects payment methods from a predefined list.regions: Randomly selects regions from a predefined list.
- Create DataFrame:
- A dictionary
datais created to store the generated data, with column names as keys and the random data arrays as values. pd.DataFrame(data)creates a Pandas DataFrame from the dictionary.
- A dictionary
- Display and Save:
sales_df.head()displays the first few rows of the DataFrame to give you a preview of the data.sales_df.to_csv('sales_demo.csv', index=False)saves the DataFrame to a CSV file named “sales_demo.csv”.index=Falseprevents the DataFrame index from being written to the CSV file.
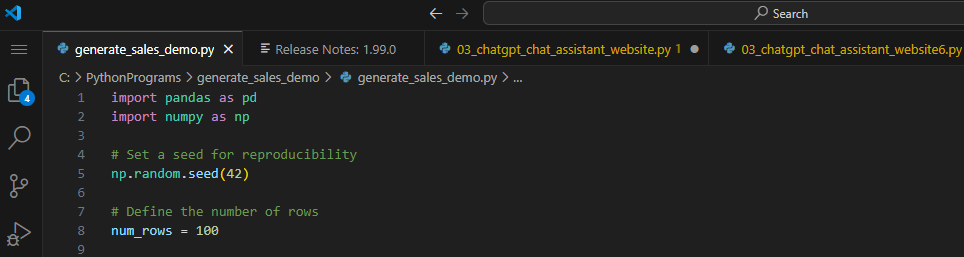
Section 1: Setting Up Your Environment
(Image: Visual Studio Code)
“First, you’ll need Python installed on your computer. If you don’t have it already, you can download it from https://www.python.org/downloads/. You’ll also need the pandas and numpy libraries. Open your terminal or command prompt and run the following commands:”
pip install pandas numpy
“This command uses pip, Python’s package installer, to download and install the necessary libraries.”
Section 2: The Code – Let’s Generate Some Data!
(Code Block: Full code snippet of the script)


Let’s break down what’s happening here:
- “We import
pandasfor data manipulation andnumpyfor random number generation.” - “We define a dictionary,
product_mapping, to store product IDs and their descriptions. This allows us to create more realistic data.” - “We generate random data for each column:
ProductID,CustomerID,SaleDate,SaleAmount,PaymentMethod, andRegion.np.random.choicepicks values randomly from a list,np.random.randintgenerates random integers, andnp.random.uniformcreates random floating-point numbers.” - If a
ProductIDisn’t found in the dictionary, it defaults to ‘Unknown Product’.” - “Finally, we create a Pandas DataFrame from the generated data and save it to a CSV file named
sales_data.csv.”
Section 3: Understanding the Code – Key Concepts

(Image: Visual representation of the dictionary product_mapping)
“Let’s dive a little deeper into some of the key concepts used in this script:”
- Dictionaries: “Dictionaries are powerful data structures that store data in key-value pairs. In our script, we use a dictionary to map product IDs to descriptions.”
- List Comprehensions: “List comprehensions provide a concise way to create lists. We use a list comprehension to create the ‘ProductDescription’ column based on the
product_mappingdictionary.” pandasDataFrame: “ApandasDataFrame is a two-dimensional labeled data structure with columns of potentially different types. It’s like a spreadsheet in Python!”- If the key doesn’t exist, it returns a default value (in our case, ‘Unknown Product’).”
Section 4: Next Steps & Customization

(Image: View the generated CSV file in a spreadsheet program – Excel)
“Now that you’re able to generate your own sales data, here are a few ideas for customization:”
- Add more product descriptions: “Expand the
product_mappingdictionary to include more products.” - Adjust data ranges: “Modify the ranges used to generate random numbers to create more realistic data.”
- Add more columns: “Add columns for things like shipping costs, discounts, or customer demographics.”
- Analyze the data: “Use
pandasto analyze the generated data, calculate statistics, and create visualizations.”
“Congratulations! You’ve successfully generated your own sales dataset using Python. This is just the beginning – explore the power of pandas and numpy to unlock even more possibilities!”


Comments are closed.