

Expense Analytics Dashboard Version 4
The Expense Analytics Dashboard Version 4 is a browser-based financial analytics tool designed to transform raw CSV expense data into interactive visual reports and summaries in real time.
Built using HTML, CSS, Python (PyScript), Pandas, and Chart.js, the dashboard provides an easy way to analyze company expenses without requiring a backend server or database.
Main Features
📊 Interactive Expense Visualizations
The dashboard automatically generates charts and summaries from uploaded CSV files, allowing users to quickly identify trends and spending patterns.
💰 Financial Metrics
Key financial indicators are calculated instantly, including:
- Total expenses
- Average expense
- Highest expense
- Total transaction count
- Reporting period
🏢 Department Analysis
Expenses are grouped by department to show which business areas generate the highest costs.
🗂 Category Breakdown
Users can view spending distribution across expense categories such as:
- Travel
- Office Supplies
- Software
- Marketing
- Utilities
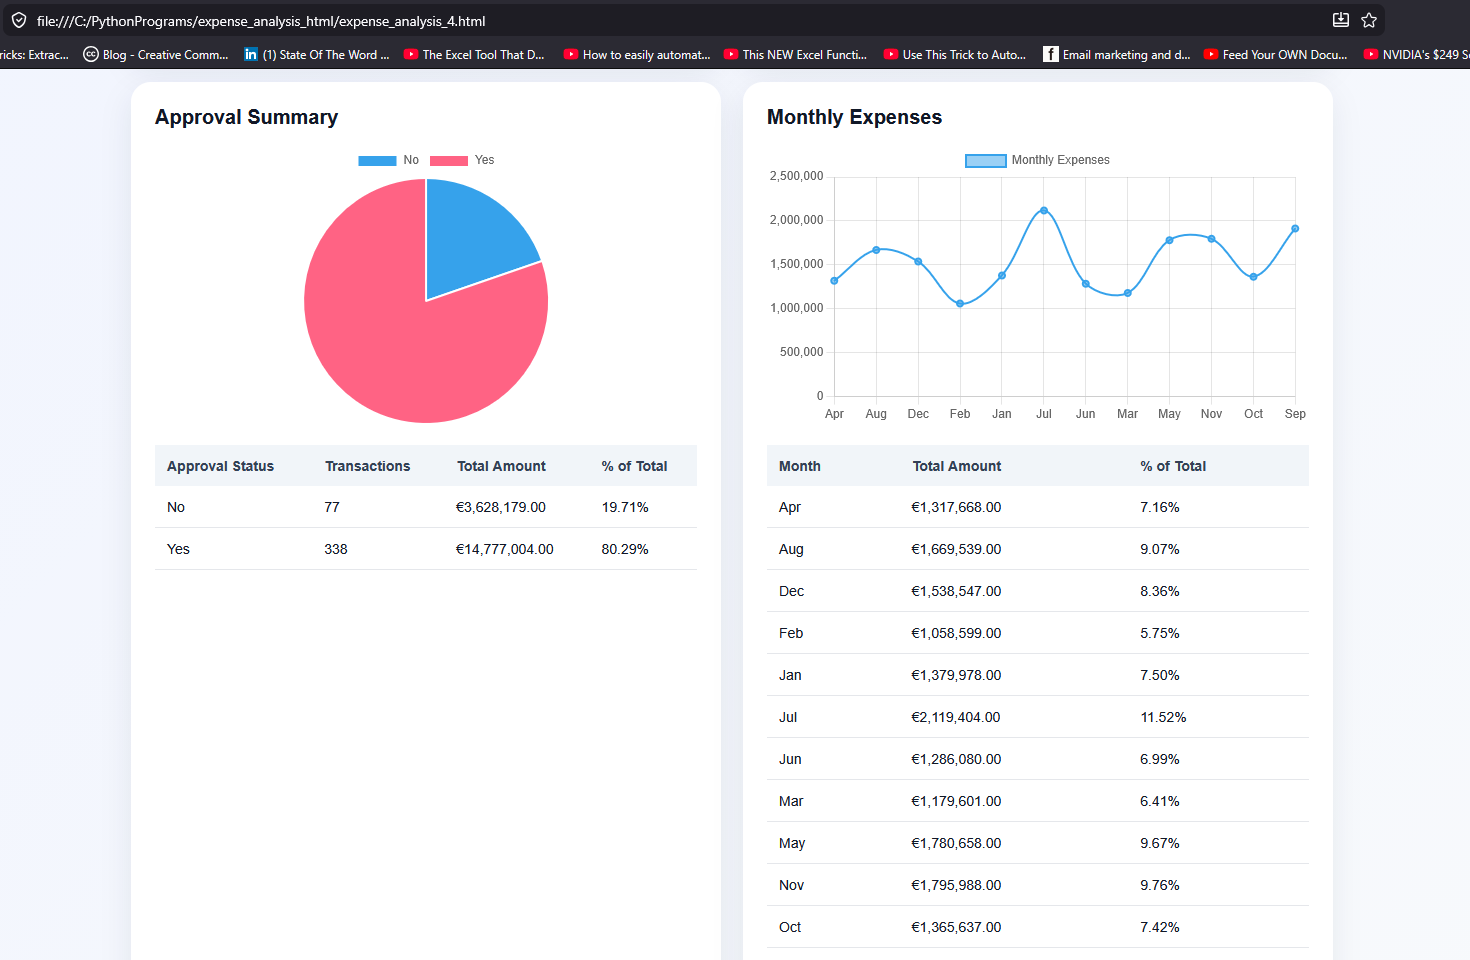
✅ Approval Status Tracking
The dashboard summarizes approved and non-approved expenses and displays their percentage contribution to overall spending.
📈 Monthly Expense Trends
Monthly totals are visualized through line charts to help identify seasonal or recurring spending patterns.
📅 Automatic Reporting Period Detection
The system automatically detects the earliest and latest dates in the uploaded CSV file and displays the reporting period dynamically.
📉 Percentage-Based Insights
Each table includes percentage calculations showing the contribution of each department, category, or month relative to total expenses.
Technologies Used
| Technology | Purpose |
|---|---|
| HTML5 | Structure and layout |
| CSS3 | Styling and responsive design |
| PyScript | Running Python directly in the browser |
| Pandas | Data analysis and aggregation |
| Chart.js | Interactive charts and visualizations |
How the Dashboard Works
- The user uploads a CSV expense report.
- The dashboard reads the file directly in the browser.
- Python and Pandas process the data instantly.
- Financial summaries and grouped analytics are generated.
- Interactive charts and tables are displayed automatically.
No data is uploaded to a server, making the dashboard lightweight and privacy-friendly.
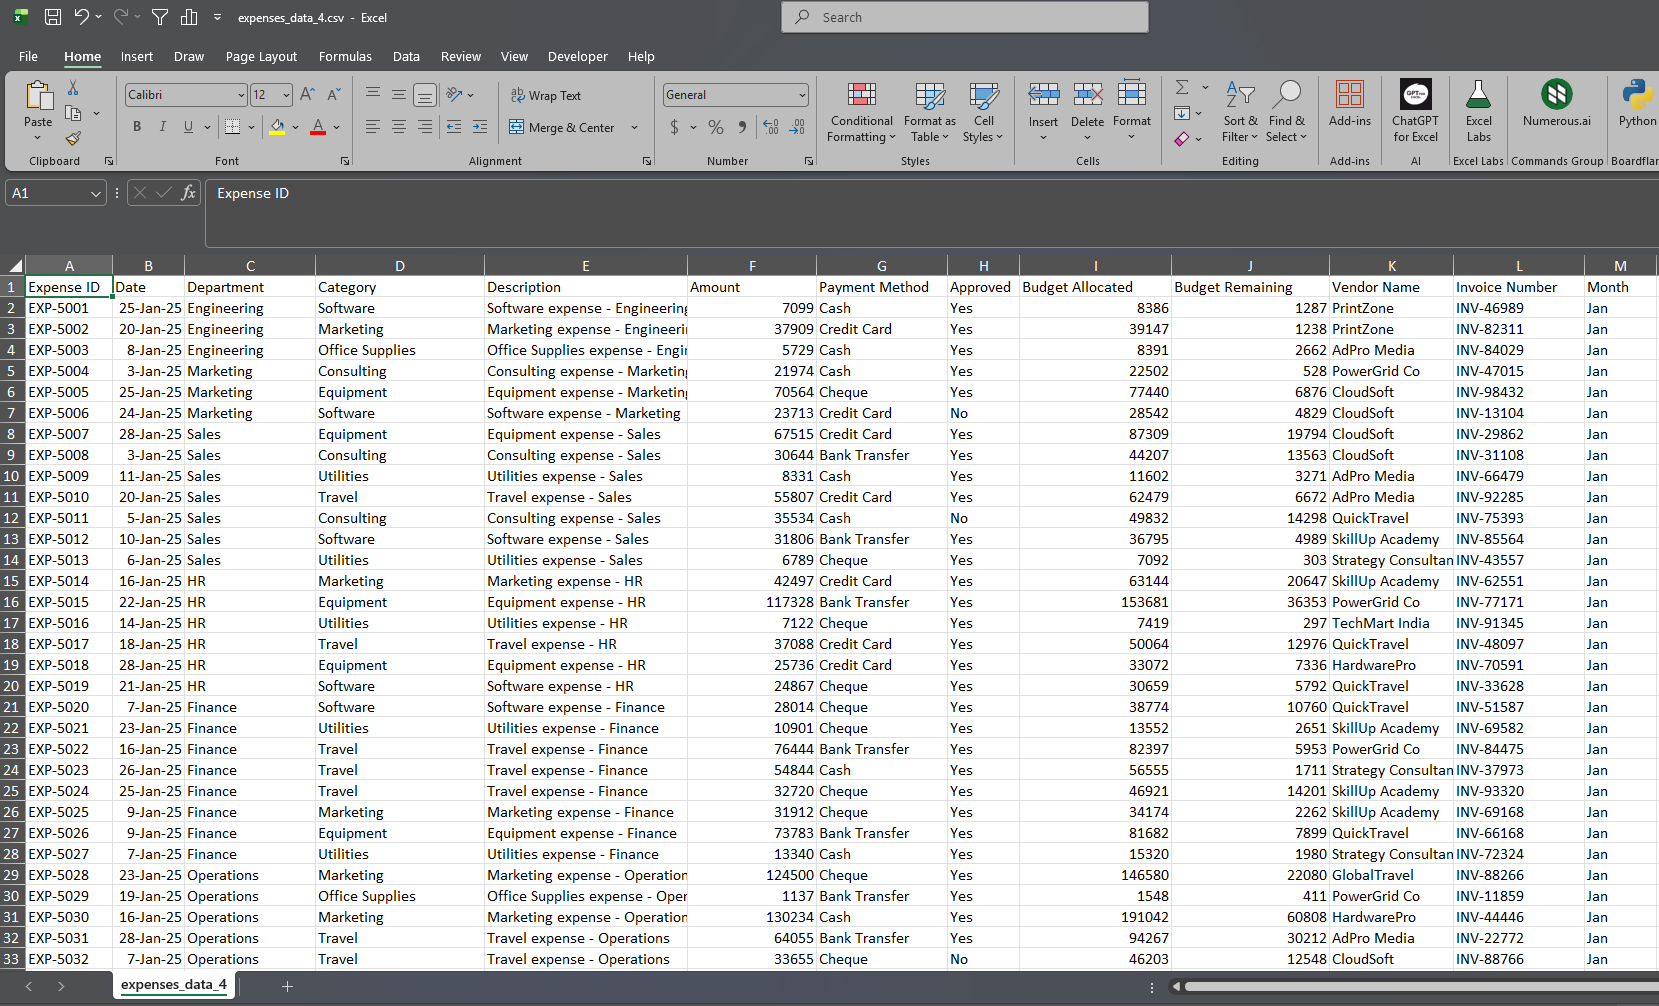
Supported CSV Data
The dashboard supports CSV files containing fields such as:
- Expense ID
- Date
- Department
- Category
- Description
- Amount
- Payment Method
- Approval Status
- Vendor Name
- Invoice Number
- Month
Benefits
- Fast client-side analytics
- No backend infrastructure required
- Lightweight and portable
- Interactive financial reporting
- Modern responsive UI
- Easy CSV-driven workflow
- Ideal for internal reporting and demonstrations
Use Cases
The dashboard can be used for:
- Expense management
- Budget monitoring
- Financial reporting
- Department spending analysis
- Approval workflow reviews
- Educational and analytics projects
- Small business reporting systems
Version: 4
Developed by: Tryfon Papadopoulos
Filenames: “C:\PythonPrograms\expense_analysis_html\expense_analysis_4.html”, “C:\macro_enabled_excel_files\expenses_data_4.csv”


Comments are closed.