

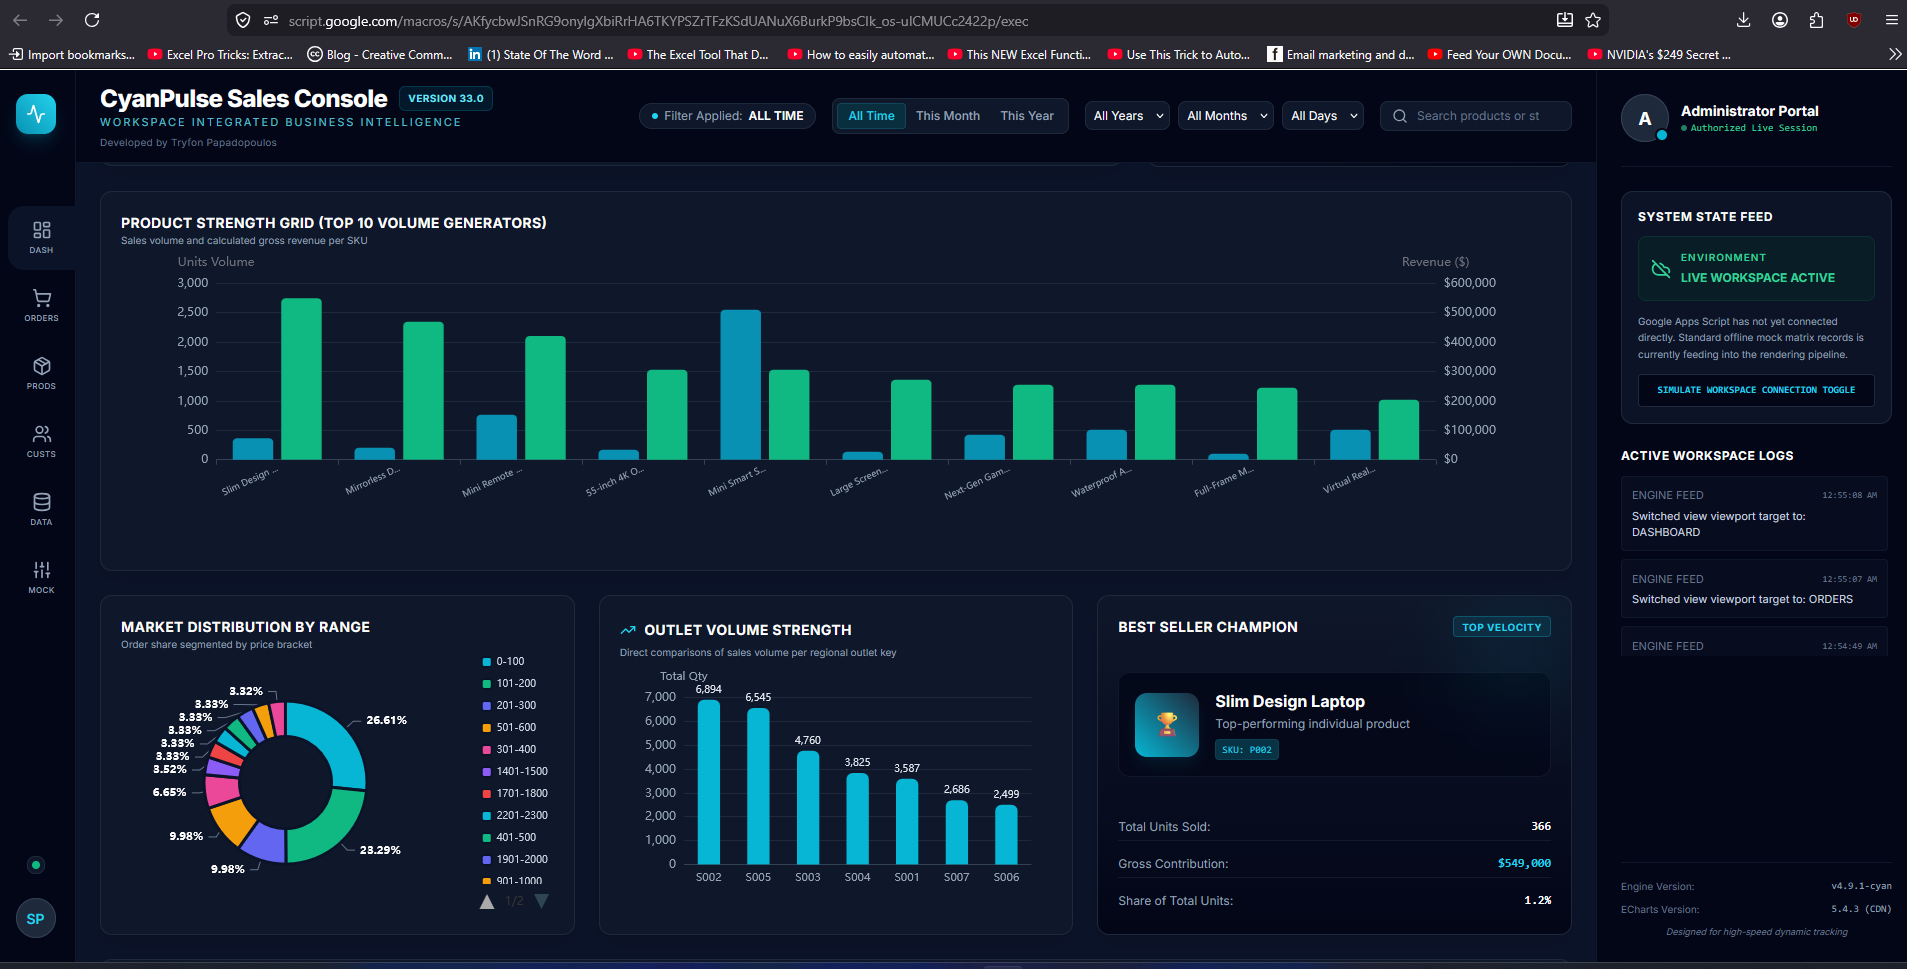
CyanPulse Sales Console – Smart Sales Analytics Dashboard
The CyanPulse Sales Console is a modern sales analytics dashboard designed to transform raw transactional data into clear business intelligence insights. Built with Google Apps Script, Tailwind CSS, and Apache ECharts, the dashboard provides a clean and interactive environment for monitoring sales performance, customer behavior, product strength, and operational trends in real time.
The system combines:
- dynamic KPI monitoring,
- advanced filtering,
- interactive charts,
- customer segmentation,
- product performance analytics,
- and transactional audit tracking
into a single unified workspace.
Key Features
✔ Interactive revenue and quantity analytics
✔ Product performance visualization
✔ Customer segmentation and LTV analysis
✔ Paginated customer and product performance tables
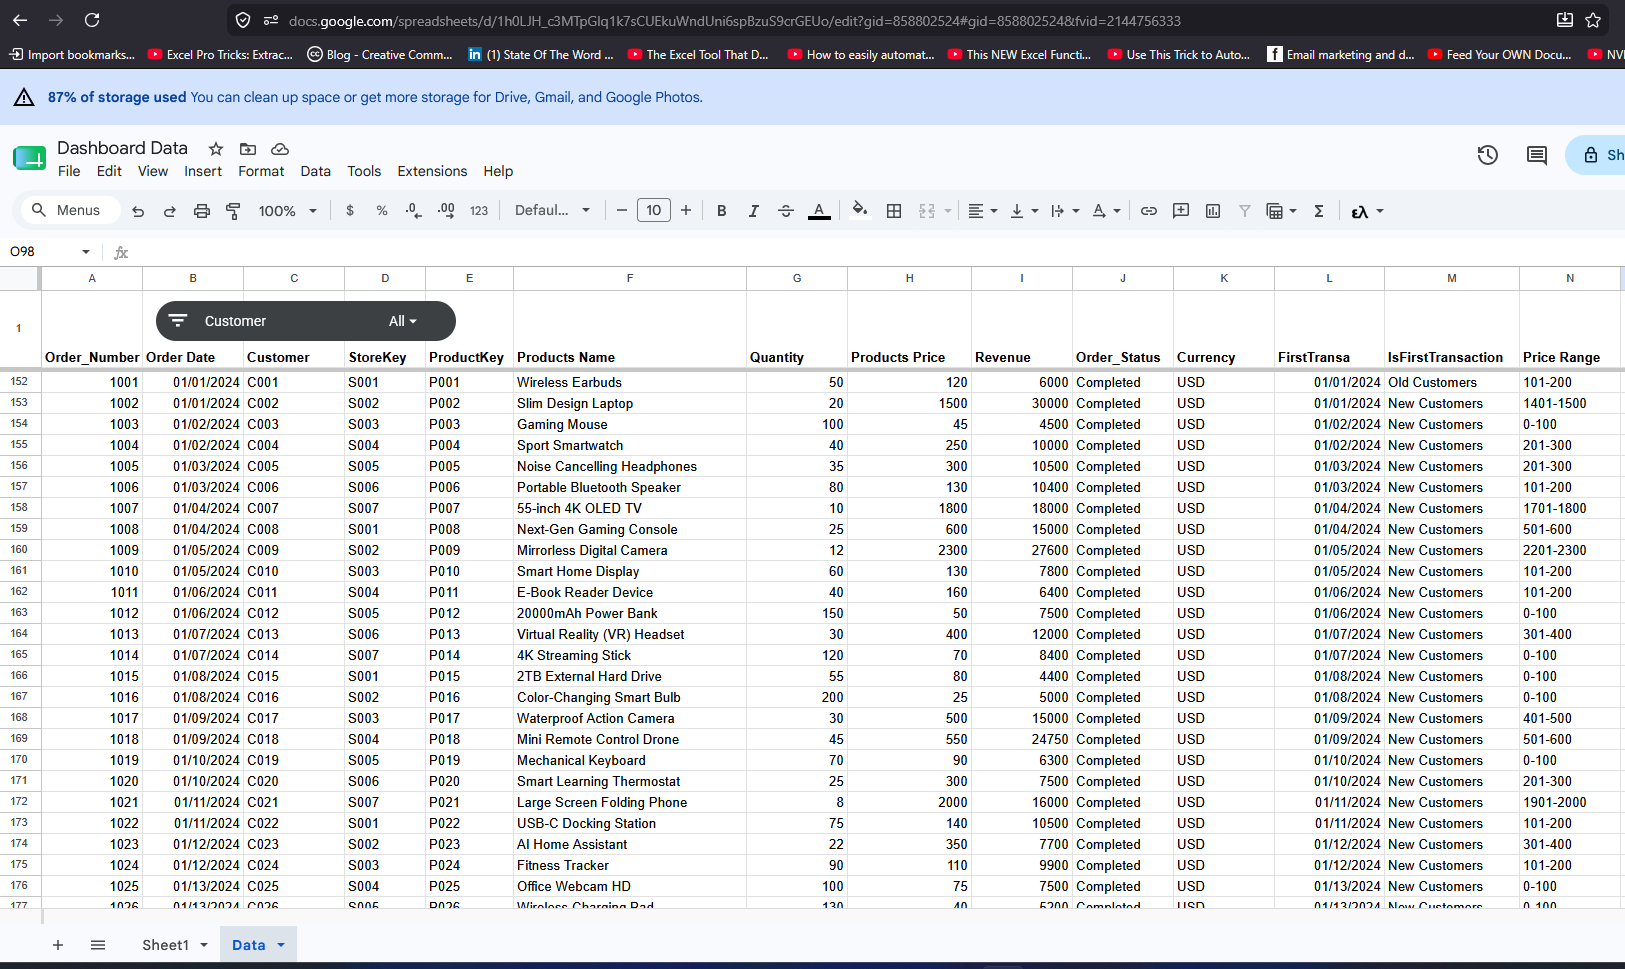
✔ Dynamic Google Sheets integration
✔ Responsive dark-mode UI inspired by modern BI platforms
✔ Smart filtering by date, search terms, and order status
✔ Real-time dashboard rendering with ECharts
The dashboard was designed to simulate the experience of enterprise-level business intelligence platforms such as Power BI and Tableau, while remaining lightweight and fully customizable through Apps Script and front-end technologies.
Technologies Used
- Google Apps Script
- JavaScript
- Tailwind CSS
- Apache ECharts
- HTML5
- Responsive UI Design
Purpose
The project demonstrates how modern dashboards can help businesses:
- monitor sales performance,
- identify high-performing products,
- evaluate customer acquisition,
- and support faster data-driven decision making.
Watch it live
Designed and developed by Tryfon Papadopoulos using AI-assisted development and online learning resources
Dashboard Data


Comments are closed.