Category

MICROSOFT EXCEL TIPS

Category

Use ‘Sheet1’ (data) in excel file: sales_jan_feb_mar_2021_d.xlsx and do the following: 1) Read all columns of the excel file: sales_jan_feb_mar_2021_d.xlsx – 9 columns 2) Read specific columns of the excel file (Month, Actual_Sales, Customer, Salesperson): sales_jan_feb_mar_2021_d.xlsx – 4 columns 3) Create new excel file: Actual_Sales Mean by Salesperson.xlsx 4) Create new excel file: Actual_Sales Mean by Customer.xlsx 5) Create new excel file: Actual_Sales Mean by Month.xlsx 6) Create new tab: ActSalesMean by Salesperson in existing excel file: sales_jan_feb_mar_2021_d.xlsx and find actual sales mean by salesperson 7) Create new tab: ActSalesMean by Customer in existing excel file: sales_jan_feb_mar_2021_d.xlsx and find actual sales mean by customer 8) Create new tab: ActSalesMean by Month in existing excel file: sales_jan_feb_mar_2021_d.xlsx and find actual sales mean by month 9) Plot Actual_Sales Mean for 3, 4 and 5 10) Change styling of columns (font, alignment) for tabs: ‘ActSalesMean by Salesperson’, ‘ActSalesMean by Customer’, ‘ActSalesMean by Month’…

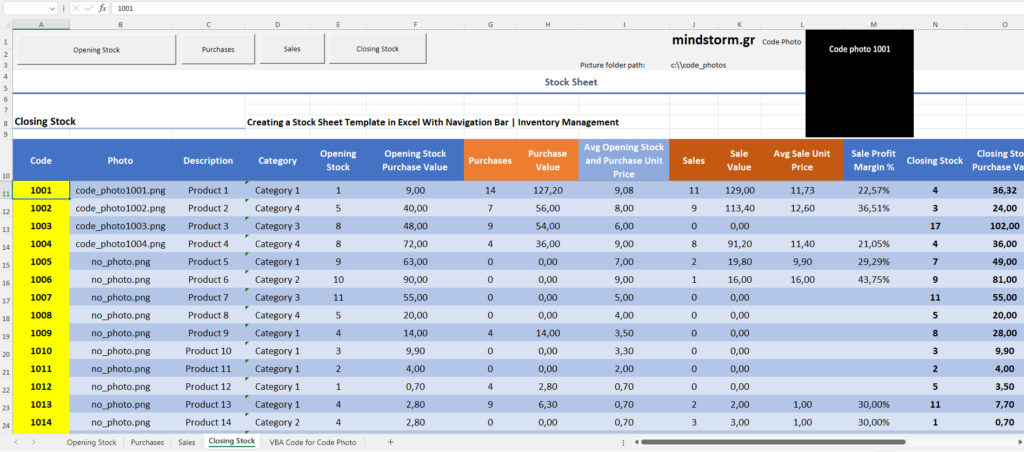
EN VBA Code to view the picture (if available) of a product on a worksheet – Excel Insert picture in a shape Pictures of products: C://code_photos GR Κώδικας VBA για την προβολή φωτογραφίας (εφόσον υπάρχει) προϊόντος σε ένα φύλλο εργασίας – Excel Οι φωτογραφίες των προϊόντων βρίσκονται στον φάκελο C://code_photos YouTube : https://www.youtube.com/watch?v=GuN4y2jV6-A #mindstormGR #vba #excel_tips #excel #insert_picture_in_shape Buy me a coffee

Use of chatGPT and YouTube to become a Data Analyst – Χρήση του chatGPT και του YouTube για να κάνει κάποιος ανάλυση δεδομένων Code file: app.py Folder: C:\PythonPrograms\data_analysis_with_chatGPT 1) Merge multiple excel files – Συγχώνευση πολλών αρχείων excel data1.xlsx data2.xlsx data3.xlsx data4.xlsx 2) Clean data – Καθαρισμός δεδομένων 3) Create two excel reports (Total Revenue, Expenses and Profit by Category) and (Total Revenue, Expenses and Profit by Country) – Δημιουργία δύο αρχείων excel (category_report.xlsx and country_report.xlsx) 4) Add a chart to category_report.xlsx – Προσθήκη γραφήματος στο αρχείο excel category_report.xlsx 5) Add a chart to country_report.xlsx – Προσθήκη γραφήματος στο αρχείο excel country_report.xlsx 6) Build two interactive plots (category_chart.html and country_chart.html) 7) Create a streamlit dashboard with 2 graphs – Δημιουργία ενός πίνακα προβολής και διαχείρισης streamlit με 2 γραφήματα με τη βοήθεια της γλώσσας Python – with Python. Changed code by Trifonas Papadopoulos: #Code starts…

Scenario for using Python and Excel Request 1 Take the following 3 excel files: sales_jan_2022.xlsx sales_feb_2022.xlsx sales_mar_2022.xlsx and create a new excel: sales.xlsx and a new csv file: sales.csv with all the records from these 3 excel files. Request 2 Take the following 3 excel files: sales_jan_2022.xlsx sales_feb_2022.xlsx sales_mar_2022.xlsx and create a new excel: total_sales.xlsx and a new csv file: total_sales.csv with total of Actual_Quantity for each month. Request 3 Take the following 3 excel files: sales_jan_2022.xlsx sales_feb_2022.xlsx sales_mar_2022.xlsx and create a new excel: total_sales_by_salesperson.xlsx and a new csv file: total_sales_by_salesperson.csv with total of Actual_Sales per month for each salesperson. Request 1, 2 and 3 are completed with python script: main.py. See it in action . . . (watch the video below) Request 4 Take the following excel files: sales.xlsx total_sales_by_salesperson.xlsx and change the styling so it is easier to read them. Request 4 is…

Rules 1) If Sales >= 20000, then 4% commission 2) If Sales >= 5000 and < 20000, then 5% commission 3) If Sales >= 1 and < 5000, then 6% commission D3 cell function =IF(C3>=$G$3;$H$3;IF(C3>=$G$4;$H$4;$H$5))*C3 D4 cell function =IF(C4>=$G$3;$H$3;IF(C4>=$G$4;$H$4;$H$5))*C4 D5 cell function =IF(C5>=$G$3;$H$3;IF(C5>=$G$4;$H$4;$H$5))*C5 D6 cell function =IF(C6>=$G$3;$H$3;IF(C6>=$G$4;$H$4;$H$5))*C6 Δείτε το σχετικό άρθρο στο blog της ιστοσελίδας softexperia.com . . .

Did you know you can use Python code to create an Excel Data Entry Form and avoid duplicate records? Πώς να δημιουργήσετε μια φόρμα εισαγωγής δεδομένων σε 10 λεπτά με τη γλώσσα προγραμματισμού PYTHON (No VBA) Πώς να διασφαλίσετε ότι δεν θα κάνετε διπλοεγγραφές Excel fields : Name, City, Favorite Color, German, Spanish, English, Children Excel before data entry Data entry form Excel after data entry ‘Python code starts here. import PySimpleGUI as sg import pandas as pd # Add some color to the window sg.theme(‘DarkTeal9’) EXCEL_FILE = ‘data_entry.xlsx’ df = pd.read_excel(EXCEL_FILE) layout = [ [sg.Text(‘Please fill out the following fields:’)], [sg.Text(‘Name’, size=(15,1)), sg.InputText(key=’Name’)], [sg.Text(‘City’, size=(15,1)), sg.InputText(key=’City’)], [sg.Text(‘Favorite Color’, size=(15,1)), sg.Combo([‘Green’, ‘Blue’, ‘Red’], key=’Favorite Color’)], [sg.Text(‘I speak’, size=(15,1)), sg.Checkbox(‘German’, key=’German’), sg.Checkbox(‘Spanish’, key=’Spanish’), sg.Checkbox(‘English’, key=’English’)], [sg.Text(‘No. of Children’, size=(15,1)), sg.Spin([i for i in range(0,16)], initial_value=0, key=’Children’)], [sg.Submit(), sg.Button(‘Clear’), sg.Exit()] ] window = sg.Window(‘Simple data entry form’, layout) def clear_input(): for key…

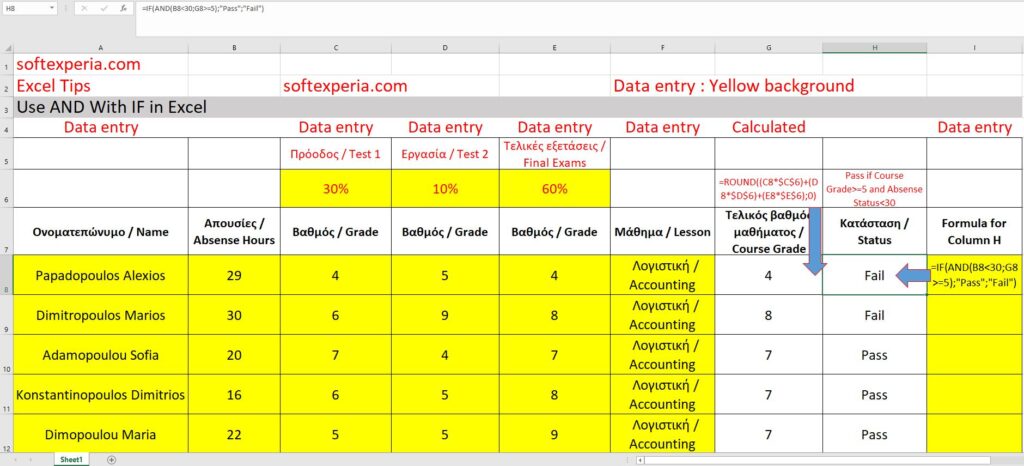
Συσχετισμός απουσιών και εξετάσεων σπουδαστών για την απόδοση του τελικού βαθμού και τo status του μαθήματος για κάθε σπουδαστή (Pass or Fail) / Course Grade and Status Use AND with IF in Excel Δείτε πώς μπορείτε να συνδυάσετε τις απουσίες και τους βαθμούς των εξετάσεων για να βγάλετε την τελική κατάσταση Pass or Fail για τον κάθε σπουδαστή. Για να περάσεις το μάθημα, πρέπει οι απουσίες σου να είναι λιγότερες από 30 και ο τελικός βαθμός σου, ίσος ή μεγαλύτερος του 5. Ο τελικός βαθμός στρογγυλοποιείται σε ακέραιο αριθμό. Π.χ. το 6,7 γίνεται 7 και το 6,2 γίνεται 6. FB Tags : #softexperia #excel_tips

VLOOKUP with 2 criteria (Sales Agent and Region) – Excel Formula for column I7 (Revenue) =VLOOKUP(H7;C7:D13;2;FALSE) Formula for column C7 (Helper) =A7&”|”&B7 Formula for column H7 (Helper) =F7&”|”&G7 Filename path (be quiet!) : C:\SystemF_SSD_Ext_3_2_2021\Documents\vlookup2_softexperia.xlsx Download excel file VLOOKUP with 2 Criteria in Excel A standard VLOOKUP function only takes one criterion. In other words, it can search by one column at a time. It can return the Sales Agent Revenue or the Region Revenue but not the combo. The first way to fix this problem is using a helper column. Let me explain. We will add a new column called “helper”. In this column C, we’ll create a unique identifier by concatenating the Sales Agent name with the Region name. To do this, just open a new formula, select the Sales Agent name, add an ampersand, then a pipe in quotes, another ampersand, and finally the Region name. The…

Μετατροπή ποδιών σε μέτρα Feet Meter Formula for column Meter 20,00 6,10 =CONVERT(A5;”ft”;”m”) Μετατροπή βαθμών Φαρενάιτ σε Κελσίου Degree Fahrenheit Degree Celsius Formula for Degree Celsius 100,00 37,78 =CONVERT(D5;”F”;”C”) Μετατροπή ιπποδύναμης (HP) σε βατ (Watt) HP Watt Formula for column Watt 55,00 41013,49 =CONVERT(G5;”HP”;”W”)

Let’s assume that you have 2 excel files : product_data_excel.xlsx (99 rows x 5 columns, A2: E100) product_data_excel_2.xlsx (107 rows x 5 columns, A2:E108) The 5 columns of the two excel files are : product_id, product_description, quantity, regular_price and category.product_data_excel.xlsx You have changed quantity and price values for existing product_ids : “A0001” and “A0003” (column : “product_id”) and you have added 8 new products in excel file : product_data_excel_2.xlsx. product_data_excel_2.xlsx Now you want to compare product_data_excel.xlsx and product_data_excel_2.xlsx and create a new excel file  : product_data_excel_changed_and_new_records.xlsx and csv file : product_data_excel_changed_and_new_data.csv with the 2 existing products you have changed and the 8 new ones you have added. product_data_excel_changed_and_new_records.xlsx Download product_data_excel.xlsx, product_data_excel_2.xlsx, product_data_excel_changed_and_new_records.xlsx, product_data_excel_changed_and_new_records.csv Click comparing_data_values_between_2_excel_files to see the code (html format) . . .

Ενσωματώστε ένα πίνακα πωλήσεων (αρχείο excel) στην ιστοσελίδα σας (διαδραστική ενσωμάτωση) Επιλέξτε τις δικές σας τιμές σε Sales Person, Region, Sales Channel και Products Type και δείτε τα αποτελέσματα. Choose your values for Sales Person, Region and Products Type and see the results. Give it a try! Watch the video and see how it works . . . Download the video Interactive Sales Dashboard (format : *.mkv)

Pin It