Excel Automation Dashboard Power Query • VBA • AI • Interactive Reporting Explore the Full Project → Developed by Tryfon Papadopoulos | mindstorm.gr
🚀 What if Excel could do far more than just spreadsheets? From Power Query automation and interactive dashboards to dynamic product images, slicers, AI-generated descriptions, and real-time reporting — this custom Excel solution transforms raw data into business intelligence. Built for speed. Designed for insights. Powered by automation. 📊 Smart Data. Powerful Insights. Seamless Control. Dynamic Excel Thumbnail System with VBA & Power Query One of the biggest limitations of Excel dashboards and mini ERP systems is image handling.Embedding hundreds of images manually inside worksheets quickly makes Excel: slow, heavy, difficult to refresh, and almost impossible to scale. To solve this problem, I created a dynamic thumbnail management system using: Power Query VBA automation external image files instead of storing images directly inside the workbook. “C:\macro_enabled_excel_files\Power_Query_in_Excel.xlsm” What This VBA System Does The macro automatically: ✅ Reads image file paths from a column✅ Generates thumbnail previews dynamically✅ Supports multiple images per…
Advanced Excel Shortcuts Every Power User Should Know If you work daily with Excel reports, dashboards, financial models, ERP exports, or large datasets, learning advanced keyboard shortcuts can dramatically improve your speed and productivity. Instead of constantly navigating through menus and ribbons, professional Excel users rely on keyboard shortcuts to: work faster, navigate large datasets instantly, manage worksheets efficiently, automate repetitive tasks, and improve overall workflow accuracy. The infographic and tables above include a collection of reliable and practical Excel shortcuts that are widely supported across modern Excel versions. Reliable Advanced Excel Shortcuts Data Navigation & Selection These shortcuts help you move and select data quickly inside large spreadsheets: Ctrl + Shift + End → Select data to the last used cell Ctrl + Shift + Home → Select back to the beginning Ctrl + Shift + Right / Left / Up / Down → Select data ranges instantly Ctrl…
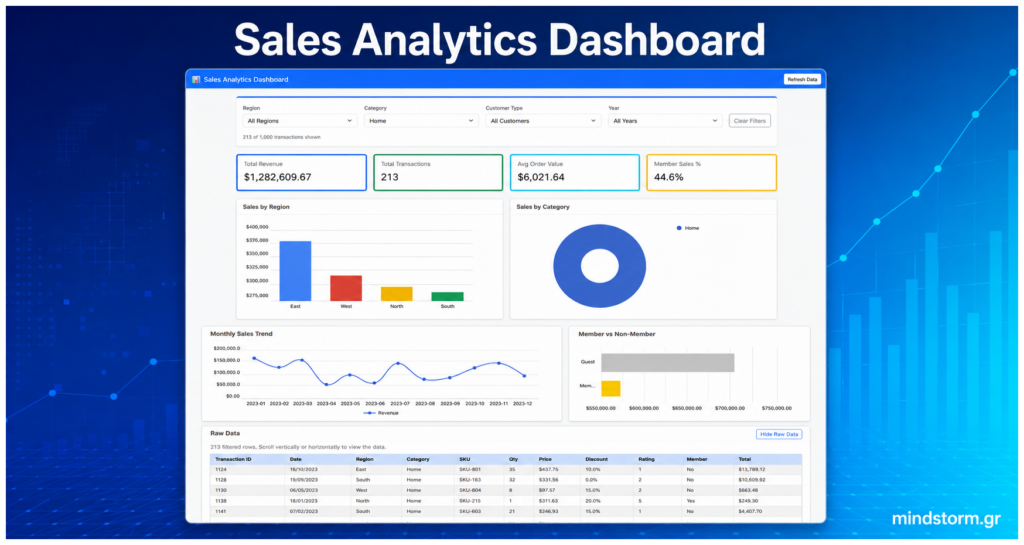
CyanPulse Sales Console – Smart Sales Analytics Dashboard This dashboard was initially created through AI prompting and was later significantly improved through extensive additional prompting and development by Tryfon Papadopoulos. Core Logic Prompt 1 Dashboard: – Create a sales management dashboard. – Create a single index.html file that includes HTML, Tailwind CSS, and JavaScript, and build charts using Apache ECharts. Use only CDN resources. – Create a code.gs file to use in Google Apps Script. The function in code.gs should send data from the “sheetName” sheet in Google Sheets to index.html for rendering the dashboard. Critical requirement in the Data Flow: If the system cannot connect to Google Apps Script, it must use predefined mock data to run in development mode. If the connection to Google Apps Script is successful, it should load data from Google Sheets and wait 3 seconds before rendering the UI. 1. Data Retrieval: – Ensures…
CyanPulse Sales Console – Smart Sales Analytics Dashboard The CyanPulse Sales Console is a modern sales analytics dashboard designed to transform raw transactional data into clear business intelligence insights. Built with Google Apps Script, Tailwind CSS, and Apache ECharts, the dashboard provides a clean and interactive environment for monitoring sales performance, customer behavior, product strength, and operational trends in real time. The system combines: dynamic KPI monitoring, advanced filtering, interactive charts, customer segmentation, product performance analytics, and transactional audit tracking into a single unified workspace. Key Features ✔ Interactive revenue and quantity analytics✔ Product performance visualization✔ Customer segmentation and LTV analysis✔ Paginated customer and product performance tables✔ Dynamic Google Sheets integration✔ Responsive dark-mode UI inspired by modern BI platforms✔ Smart filtering by date, search terms, and order status✔ Real-time dashboard rendering with ECharts The dashboard was designed to simulate the experience of enterprise-level business intelligence platforms such as Power BI…
Problem & Solution A group of sellers considers financing the sale price of a property for 82000 euros at 7% annual interest, amortized over a 30-year term with a balloon payment due after five years. They want to know : 1. Amount of the monthly payment 2. Amount of interest they will receive 3. Remaining balance at the end of the term (balloon payment) YouTube Link : https://youtu.be/79GsHHsvvKY Filename: “C:\SystemF_SSD_Ext_3_2_2021\Documents\compute_payment_interest_and_loan_balance_after_a_specified_payment.xlsm” #mindstormGR #montly_payment #interest_paid #remaining_balance
From Raw Data to an AI-Powered Dashboard: Transforming an Excel File into a Decision-Making Tool EN – Data alone is not enough.The real value comes from transforming data into meaningful information, visual insights, and actionable intelligence that supports better decision-making. In this project, a simple Excel file containing financial transactions was transformed into a fully interactive AI-Powered Expenses Dashboard using: Excel VBA Automation Pivot Tables Dynamic Charts Interactive Slicers OpenAI / ChatGPT API Integration The original dataset included: dates departments expense categories amounts payment methods approvals vendors invoices From this raw data, a complete interactive dashboard was created featuring: ✅ KPI Cards✅ Dynamic Charts✅ Department & Month Filters✅ Budget vs Actual Analysis✅ Payment Method Monitoring✅ AI-Generated Executive Insights✅ Token Usage Monitoring via OpenAI API One of the most interesting aspects of the project was integrating ChatGPT directly into Excel through VBA, allowing the dashboard to automatically generate: • business insights…
Από τα Raw Data σε AI-Powered Dashboard: Πώς μετέτρεψα ένα Excel αρχείο σε εργαλείο λήψης αποφάσεων GR – Τα δεδομένα από μόνα τους δεν αρκούν.Η πραγματική αξία δημιουργείται όταν τα μετατρέπουμε σε χρήσιμη πληροφορία, οπτικοποίηση και πρακτικά insights που βοηθούν στη λήψη αποφάσεων. YouTube Σε αυτό το project, ένα απλό Excel αρχείο με οικονομικές συναλλαγές μετατράπηκε σε ένα ολοκληρωμένο AI-Powered Expenses Dashboard, χρησιμοποιώντας: Excel VBA Automation Pivot Tables Dynamic Charts Interactive Slicers OpenAI / ChatGPT API Integration Το αρχικό dataset περιείχε: ημερομηνίες τμήματα κατηγορίες εξόδων ποσά τρόπους πληρωμής εγκρίσεις προμηθευτές invoices Από αυτά δημιουργήθηκε ένα πλήρως διαδραστικό dashboard με: ✅ KPI Cards✅ Dynamic Charts✅ Department & Month Filters✅ Budget vs Actual Analysis✅ Payment Method Monitoring✅ AI-Generated Executive Insights✅ Token Usage Monitoring μέσω OpenAI API Το πιο ενδιαφέρον σημείο του project ήταν η ενσωμάτωση του ChatGPT μέσα στο Excel μέσω VBA, επιτρέποντας στο dashboard να δημιουργεί αυτόματα: επιχειρηματικά insights παρατηρήσεις για…
Excel Filters Made Simple – A Complete Guide to Excel Filters EN – Working with large datasets in Excel can quickly become difficult without the right tools. Excel filters help you organize, analyze, and manage data more efficiently by allowing you to display only the information you need. Whether you work with: sales reports, customer lists, inventory, accounting data, or business dashboards, filters can significantly improve your productivity and make data analysis much easier. OrderID Customer Department Product Region Salesperson Month Units Revenue Status 1001 TechNova Electronics Laptop North John Jan 12 24000 Completed 1002 SmartLine Electronics Monitor South Maria Jan 20 8000 Pending 1003 GreenFoods Food Coffee East Nick Feb 35 4200 Completed 1004 BlueWave Office Printer West Anna Feb 8 3600 Completed 1005 AlphaTech Electronics Keyboard North John Mar 50 2500 Pending 1006 FreshMarket Food Tea South Maria Mar 40 3200 Completed 1007 NextGen Electronics Mouse East Nick…
If you’ve ever wanted to organize your emails into a Google Sheet, automatically categorize and track conversations, or extract specific details from your inbox, you’re in the right place! Google Apps Script allows you to easily export emails from Gmail and organize them in Google Sheets without manually copying and pasting. In this post, we’ll walk you through creating a simple Gmail-to-Google Sheets integration using Google Apps Script. This will allow you to extract emails with a specific Gmail label, along with various details such as the sender, subject, date, and even the entire email body. Why Export Emails to Google Sheets? Managing emails can be tedious, especially if you’re dealing with hundreds of messages. Exporting emails into Google Sheets gives you the power to: Track specific conversations: Extract emails by labels such as “Work” or “Important.” Analyze email data: Identify patterns or trends in communication. Organize data for easy…
Phrasal Verbs Look up – Research Give up – Surrender Take off – Remove Put off – Postpone Bring up – Mention Get along – Farewell Call off – Cancel Set up – Establish Turn down – Reject Run out – Exhaust Carry out – Execute Look after – Take care of Figure out – Solve Go on – Continue Give in – Yield Put up with – Tolerate Bring about – Cause Break down – Analyze Look for – Search Bring back – Restore
EN Ctrl + Shift + L in Excel – Toggle AutoFilter Instantly If you work with tables, reports, products, customers, or large datasets in Excel, this shortcut can save you a lot of time. Excel Shortcut Ctrl + Shift + L This shortcut quickly turns Excel filters ON or OFF for the selected table or data range. What Does It Do? When filters are enabled: Small dropdown arrows appear in the header row You can filter data by: text numbers dates categories You can sort A→Z or Z→A You can quickly find specific records Pressing the shortcut again removes the filters. How to Use It Step 1 Select any cell inside your data table. OR Select the full data range including headers. Step 2 Press: Ctrl + Shift + L Step 3 Filter dropdown arrows will appear automatically in the header row. Now you can: filter products show only specific…
ΕΝ – Can we keep exploring, seeking, working, and trying to grasp more of what is happening around us, just for the pleasure of being more truthful and wiser? 1. Yes 2. No 3. It is against our incomplete nature Location: Eidomeni / Ειδομένη, 28/11/2015 — GR – Μπορούμε να συνεχίσουμε να εξερευνούμε, να αναζητούμε, να εργαζόμαστε και να προσπαθούμε να κατανοήσουμε περισσότερο όσα συμβαίνουν γύρω μας, μόνο και μόνο για τη χαρά του να είμαστε αληθινοί και ίσως πιο σοφοί; Ναι Όχι Είναι αντίθετο με την ατελή φύση μας
Common Acronyms GST — Goods and Services Tax MRP — Maximum Retail Price OTP — One Time Password PAN — Permanent Account Number NEWS — North East West South SMS — Short Message Service ATM — Automated Teller Machine SIM — Subscriber Identity Module VIP — Very Important Person PDF — Portable Document Format WWW — World Wide Web TRP — Television Rating Point GPS — Global Positioning System CEO — Chief Executive Officer
🚀 Introducing Jarvis AI Assistant — A Smart AI Chatbot Powered by Google Sheets & OpenAI I’m excited to share a new project I’ve been developing: Jarvis AI Assistant, a fully customizable AI-powered chatbot built with Google Apps Script, Google Sheets, and OpenAI. Click here to see it live: Jarvis AI Assistant Version 23 – Apps Script The goal of this project was simple: 👉 Create an intelligent business assistant that is: easy to manage, low cost, secure, fast, and fully customizable without complex infrastructure. Unlike traditional chatbot systems that require databases and expensive platforms, Jarvis uses the power of Google Sheets as a dynamic knowledge base, allowing anyone to manage AI content directly from a spreadsheet. 💡 Key Features: ✔ Secure Login System with hashed passwords✔ Role-based access control✔ AI-powered search using OpenAI✔ Greek & English language support✔ Smart keyword matching✔ Product recommendations✔ Image thumbnail support inside chat✔ Mobile-friendly…
Δημιουργία απλής εφαρμογής γραφήματος μετοχής (Google) για την περίοδο 30/4/2015 – 30/4/2022 με γλώσσα προγραμματισμού Python. Βιβλιοθήκες (libraries) : yfinance, streamlit, pandas Βήματα 1) Εγκατάσταση των βιβλιοθηκών με τις εντολές στο powershell (command prompt) : pip install yfinance pip install streamlit pip install pandas 2) Δημιουργία αρχείου simple_stock_price_app. py με Visual Studio Code ή κάποιο άλλο επεξεργαστή κειμένου με τον κώδικα που βλέπετε παρακάτω. # code starts here ——— # ========================================================== # REQUIREMENTS CHECK # ========================================================== import sys required_packages = { “yfinance”: “yfinance”, “streamlit”: “streamlit”, “pandas”: “pandas” } missing_packages = [] for import_name, pip_name in required_packages.items(): try: __import__(import_name) except ImportError: missing_packages.append(pip_name) if missing_packages: print(“\nMissing required packages:”) for pkg in missing_packages: print(f” – {pkg}”) print(“\nInstall them with:\n”) print(f”pip install…