
Branding is the process of creating a unique identity and image for a product or company in the minds of consumers, often through the use of names, logos, design, and messaging.

The seven steps of arguing with ourslelves 1. What is the belief that I have? 2. What evidence is there to challenge this view? (The case for the prosecution.) 3. If the evidence isn’t enough: What alternative explanations are there to explain the situation? 4. If the alternative explanations and the evidence aren’t enough: What are the real consequences if my belief is correct? (So what?) 5. If you still hold on to your original belief: How useful is it to have this view? 6. Given the argument with myself, what do I need to do to improve the situation? 7. What will I do? When? Mirror, mirror One overly common and unhelpful self-belief that people have is ‘I am not attractive’. It comes in many forms, from ‘I will never find someone who wants to marry me’, through ‘No one ever looks at me in that way anymore’ to…
Marketing refers to the set of activities aimed at promoting or selling products or services. It involves research into customer’s needs, development and implementation of a sales strategy for meeting these demands while achieving organizational objectives like increased brand awareness, revenue growth, market penetration, retention rate improvements, cost reductions in production through bulk purchasing etc. Marketing includes product pricing strategies; distribution (placing the products where potential customers can find them); sales approaches and promotional campaigns to drive demand among targeted audiences using various media channels – print, online, social networks or direct communications such as phone calls or emails. The ultimate goal of marketing is not just selling a product but building long-term customer relationships by consistently delivering quality products and excellent service levels to ensure repeat business which in turn generates new customers through referrals – thus creating an enduring cycle that can make the company profitable over time.
Branding, as it relates to marketing, involves a series of processes aimed at establishing and communicating distinctive qualities about your business or product in consumers’ minds which differentiate you from competitors – helping potential customers recognize, remember, like & trust what they see when interacting with brands. This process starts by defining the unique value proposition that sets a brand apart (the reasons why people should choose it over others) and includes strategies for creating consistent messaging across all touchpoints in order to make sure everyone – from employees on the inside, customers who buy directly or indirectly through other consumers – has positive experiences with your product. Good brands are not just visually appealing but also resonate emotionally & psychologically as they tell a story about their origin, purpose and place in everyday life for people using them which often leads to brand loyalty –customers choosing one company’s products…
CTA stands for Call to Action, which refers to a marketing phrase or design that prompts the audience to take some form of action deemed desirable by the marketer. The aim of using CTAs in advertising and content creation campaigns is often to drive website traffic, sales, lead generation, brand awareness, and customer engagement among other objectives depending on a business’ goals. Example: An online clothing retailer might use an enticing CTA like “Shop Now” with an accompanyding button or link that stands out in the visual design of their web page to encourage customers to make purchases instantly rather than just browsing through products and leaving the website. The text “Shop Now” creates urgency, making it a compelling invitation for potential buyers who might feel inclined towards immediate action based on this prompt – possibly leading them back into considering future purchases as well due to positive initial experience…

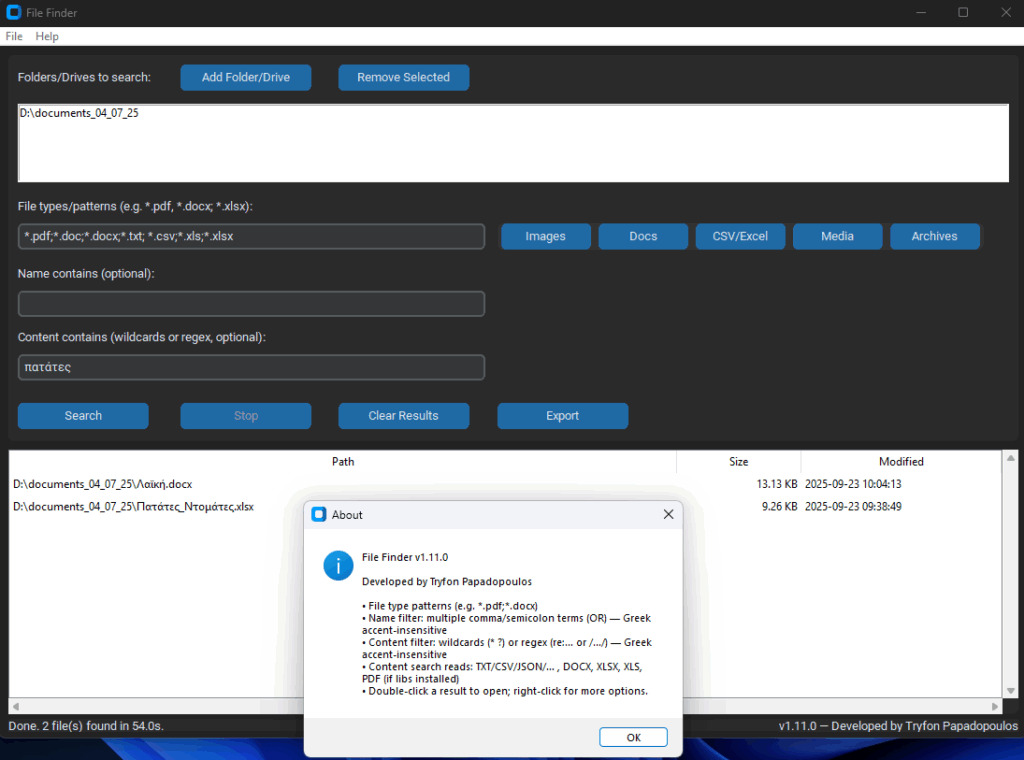
File Finder – Εύκολη και έξυπνη αναζήτηση αρχείων GR – Αυτή η εφαρμογή σε βοηθά να βρίσκεις γρήγορα αρχεία στον υπολογιστή σου. =>Διαλέγεις έναν ή περισσότερους φακέλους ή δίσκους για αναζήτηση. =>Λες τι τύπους αρχείων θέλεις (π.χ. PDF, Word, Excel, εικόνες). =>Μπορείς να γράψεις μέρος του ονόματος του/των αρχείου/ων που ψάχνεις. =>Μπορείς και να ψάξεις μέσα στα αρχεία για λέξεις ή φράσεις. =>Διαβάζει μέσα σε Word, PDF, Excel (όλα τα φύλλα), CSV και απλά κείμενα. =>Καταλαβαίνει ελληνικά και χωρίς τόνους (π.χ. “παρουσιαση” βρίσκει “παρουσίαση”). =>Τα αποτελέσματα δείχνουν πλήρη διαδρομή, μέγεθος και ημερομηνία αλλαγής. =>Με διπλό κλικ ανοίγεις το αρχείο. =>Μπορείς να αποθηκεύσεις τη λίστα σε CSV ή Excel. EN – This app helps you quickly find files on your computer. =>You choose one or more folders or drives to search. =>You tell it what kinds of files you want (like PDF, Word, Excel, images). =>You can type part of a…
Marketing: How People Find Cool Stuff They’ll Love Marketing is like being the friendly guide at a giant mall. Your job is to help people find things that actually make their lives better. First, you learn what people need. Do they want faster homework help? A cooler T-shirt? A tastier snack? Then you match those needs with the right product. Marketers use the 4 Ps (easy version): Product: What you’re offering and why it helps. Price: What it costs and why it’s fair. Place: Where people can get it (online, in a store, at a stand). Promotion: How you tell them (posts, videos, emails, ads). Imagine a lemonade stand. You test flavors (product), set a price kids can pay, choose a busy corner (place), and make a fun sign or TikTok (promotion). Then you watch what works and do more of it. Good marketing isn’t tricking people—it’s connecting the right…

When someone new is hanging out with you and your friends, call your friends by their names so the new person has a chance to memorize them. Όταν είναι κάποιος νέος στην παρέα σας, θα βοηθούσε να απευθύνεστε στους φίλους σας με τα ονόματά τους έτσι ώστε ο νέος να μπορέσει να απομνημονεύσει τα ονόματα όλων. #mindstormGR #communication #softexperia

Functions UPPER, LOWER, TRIM & PROPER See Columns Customer Before and Customer After / Δείτε τις στήλες Customer Before και Customer After View large image : https://lnkd.in/d6qV-GqD Download excel file “sales_feb_2021_a_functions.xlsx” : https://lnkd.in/dkYSGJjy #excel_tips #excel_calculations #softexperia / www.softexperia.com


