

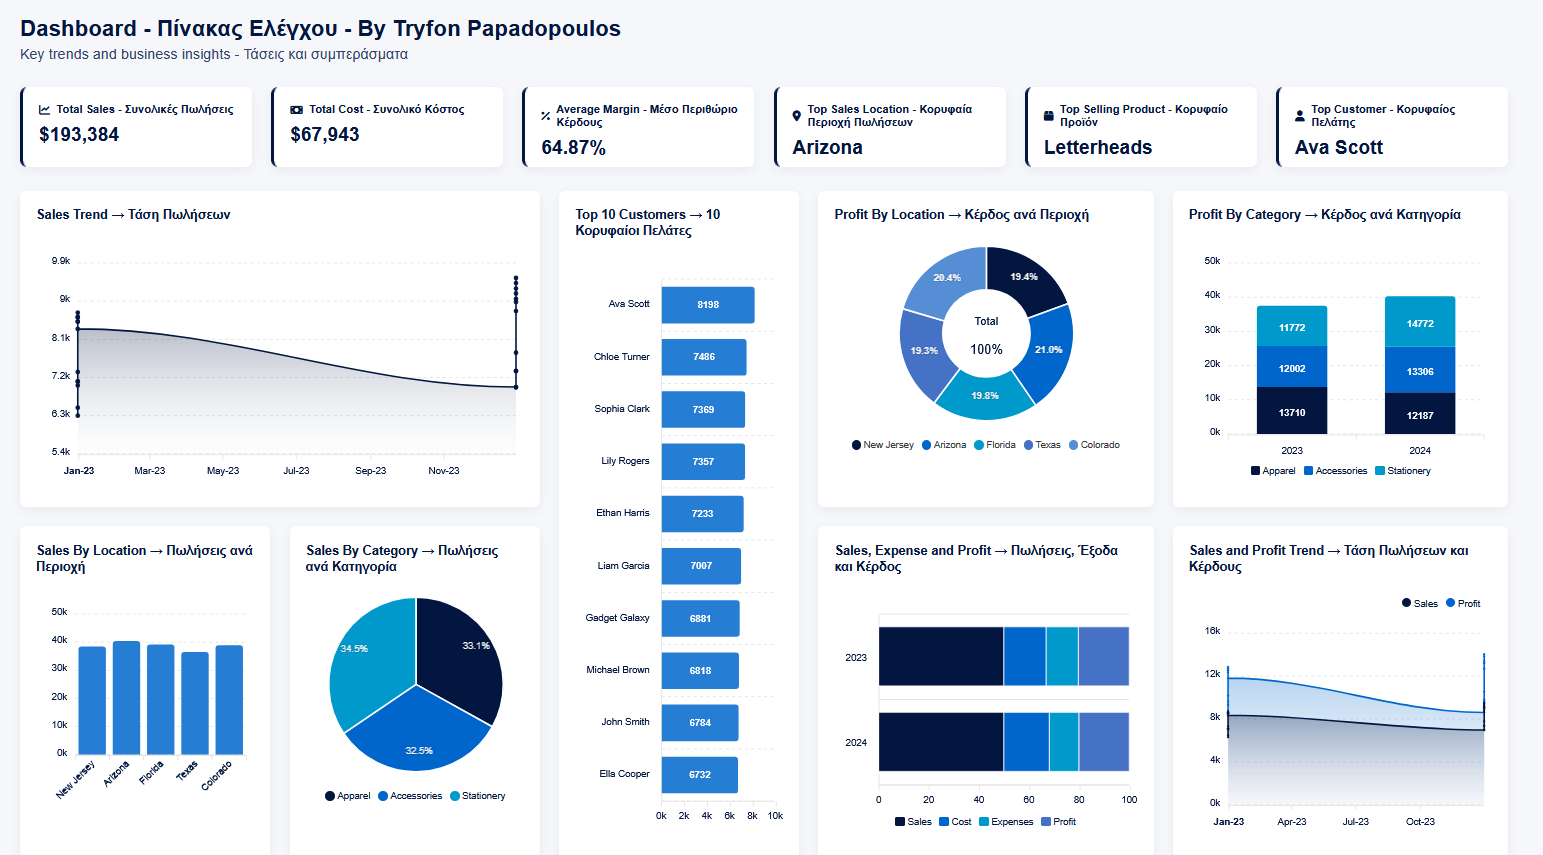
EN – The image presents an interactive business dashboard that displays key performance indicators (KPIs), such as total sales, costs, profit margin, top customers, products, and locations, along with charts showing sales and profitability trends.
The dashboard is connected to a Google Sheet, from which it automatically retrieves data, enabling dynamic updates and real-time analysis to support business decision-making.
Click here to view the Dashboard…
 YouTube Video
—
GR – Η εικόνα παρουσιάζει ένα διαδραστικό επιχειρηματικό dashboard (πίνακα ελέγχου) που απεικονίζει βασικούς δείκτες απόδοσης (KPIs), όπως συνολικές πωλήσεις, κόστος, περιθώριο κέρδους, κορυφαίους πελάτες, προϊόντα και περιοχές, καθώς και γραφήματα τάσεων πωλήσεων και κερδοφορίας.
Το dashboard συνδέεται με Google Sheet, από το οποίο αντλεί αυτόματα τα δεδομένα, επιτρέποντας δυναμική ενημέρωση και ανάλυση σε πραγματικό χρόνο για υποστήριξη επιχειρηματικών αποφάσεων.


Comments are closed.