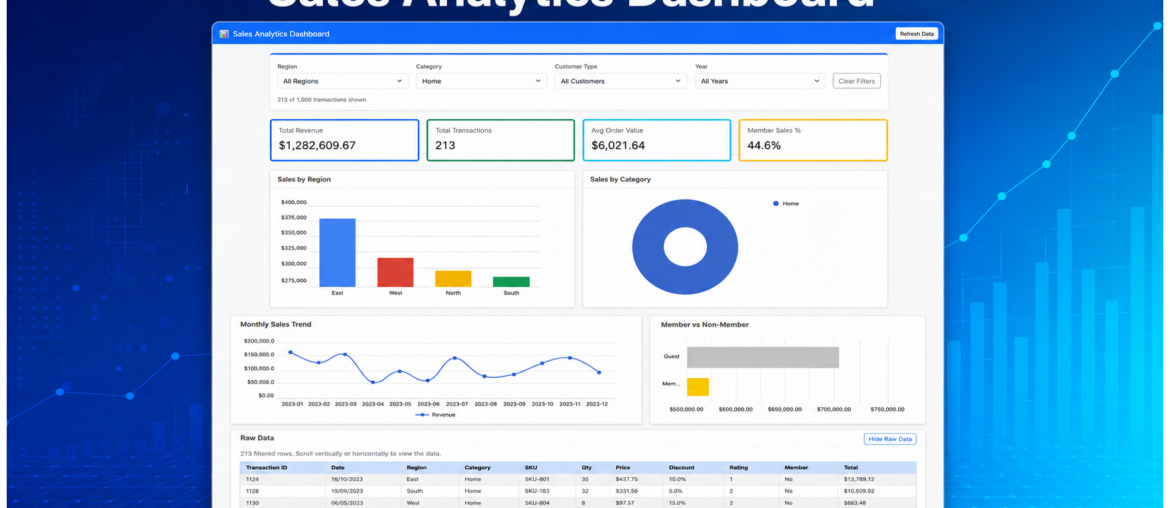
Interactive Sales Analytics Dashboard
EN – I found and developed further an interactive Sales Analytics Dashboard using Google Sheets, Google Apps Script, Bootstrap and Google Charts. The application automatically processes spreadsheet data and presents key indicators such as total revenue, transaction volume, average order value and the percentage of sales generated by members, alongside visual analyses by region, product … Continue reading Interactive Sales Analytics Dashboard
